💥 $BTC : where are the liquidations really?
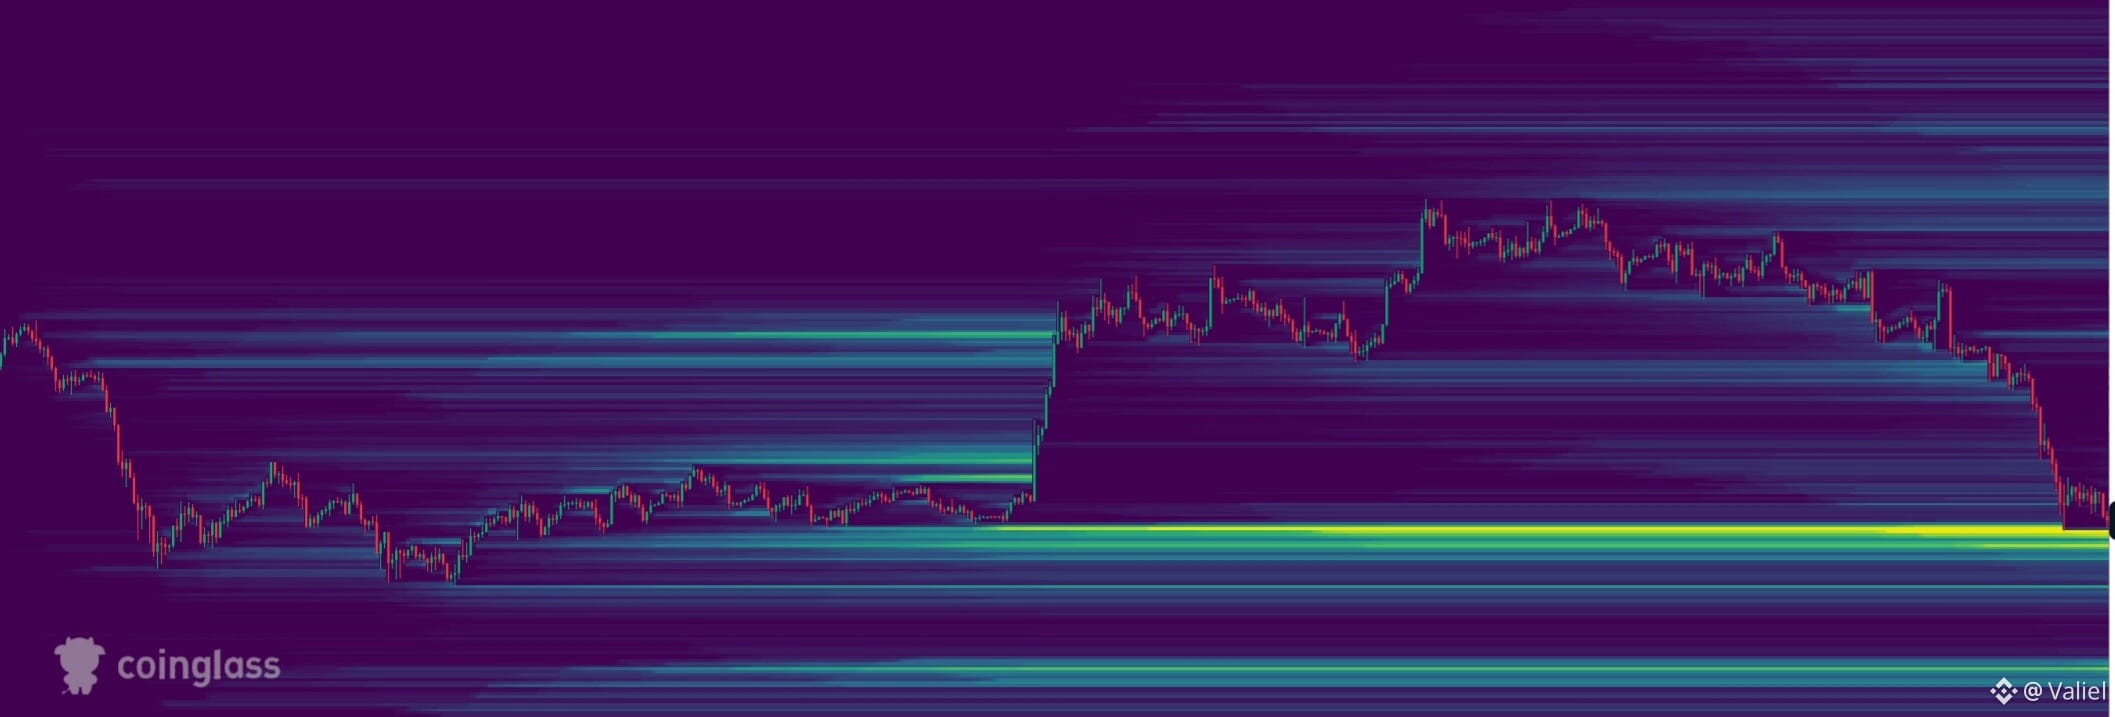
The heatmap (BTCUSDT Binance) shows a dominant pocket around 62k, almost at the current price. No notable cluster right at 60k.
🔹 Key levels
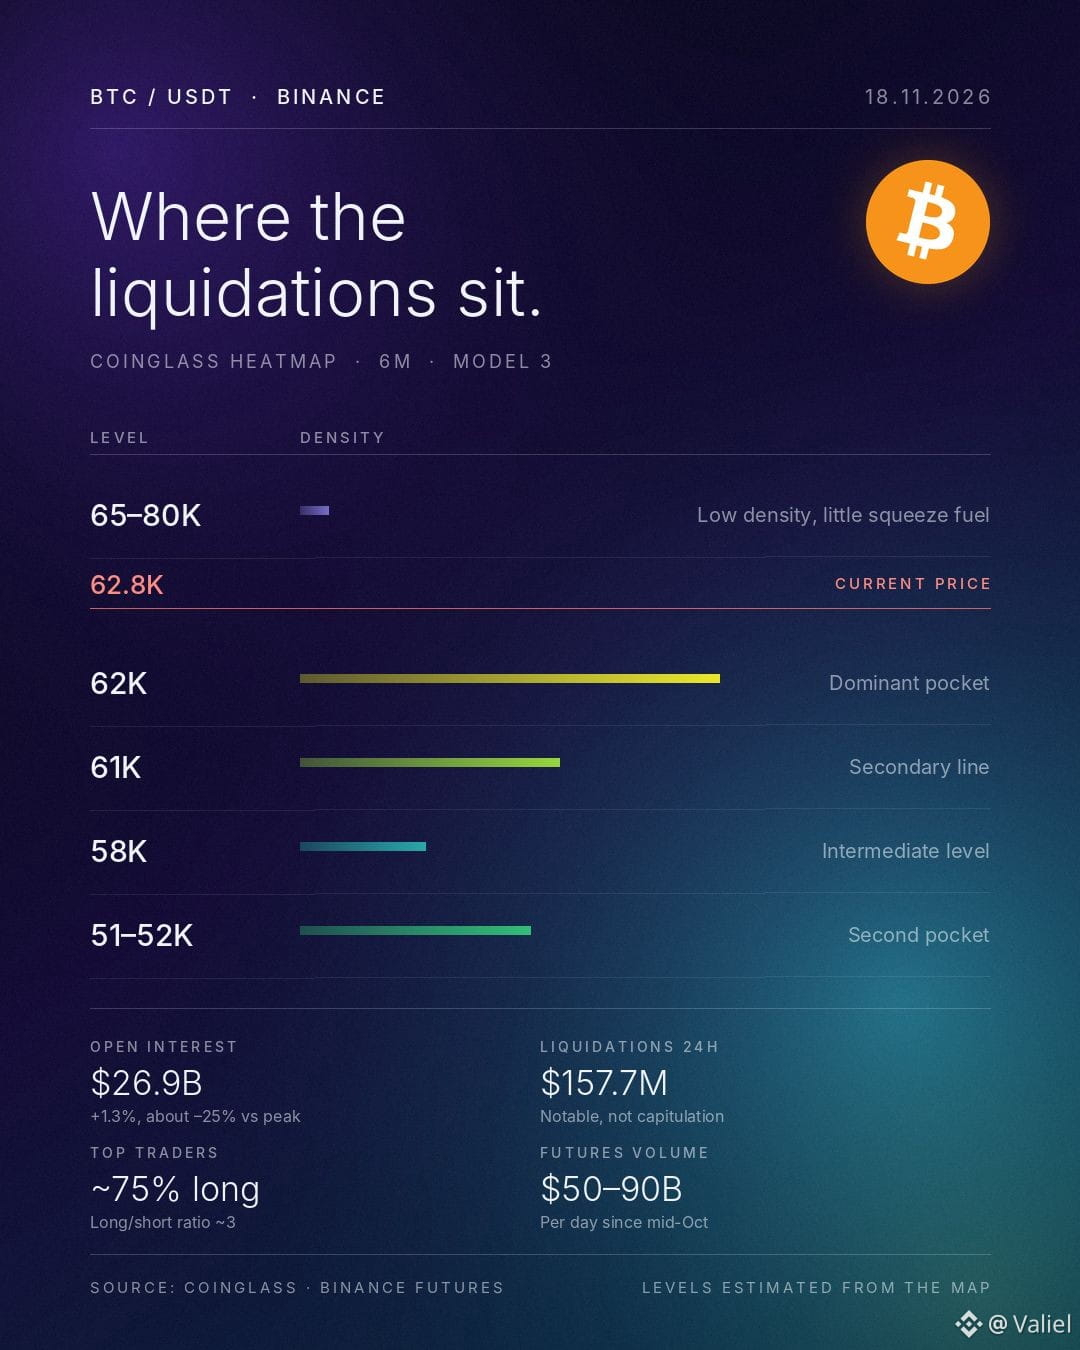
• ~62k: the largest concentration, currently being tested
• ~61k: second line, thinner, just below
• ~58k: intermediate level if 61–62k gives way
• ~51–52k: second major pocket, but far away (-18%)
• Above: little density between 65k and 80k, so little fuel for an upside squeeze
🔹 What Binance data shows
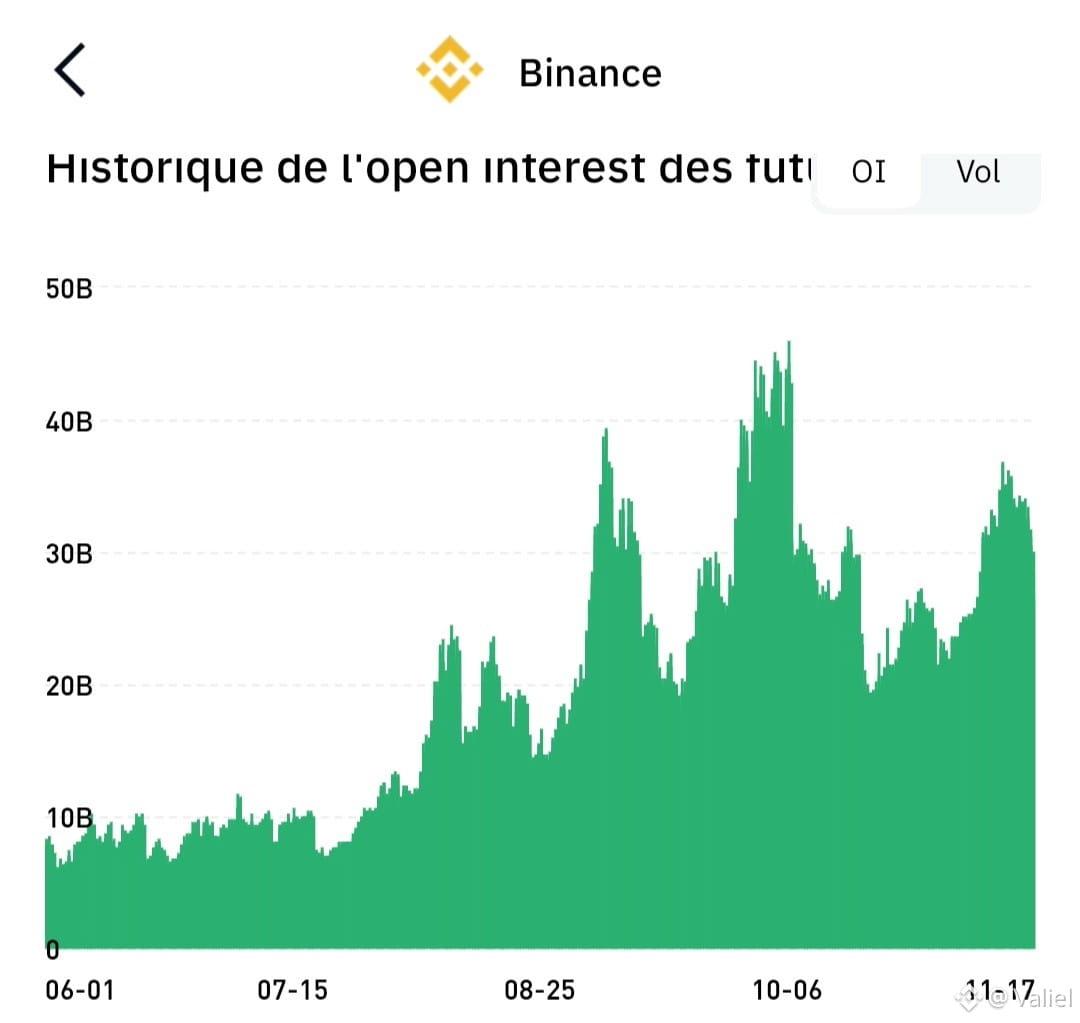
• Global OI ~ $26.9B (+1.3%), about -25% since the last peak: the cleanup has already begun
• $157.7M liquidated in 24h: notable, but not capitulation
• Top traders: about 75% of accounts are long, with a long/short ratio around 3
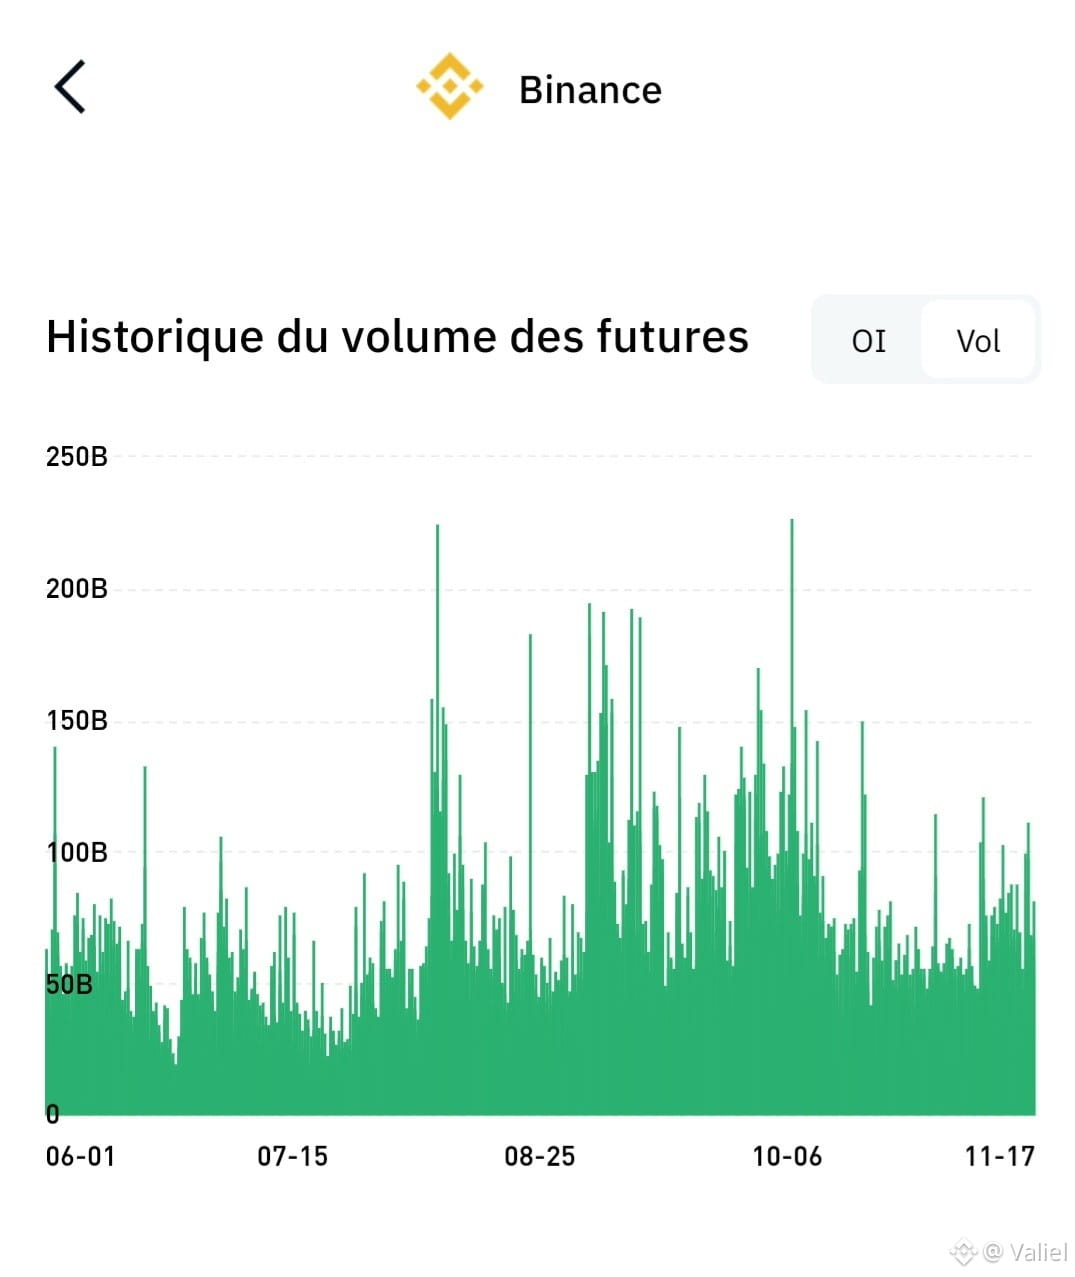
• Futures volume: $50–90B/day since mid-October, far from the panic peaks in August and October
👀 Our take
Long positioning + a large pocket just below the price = a classic liquidity-hunt setup. But moderate volume points more to a gradual flush than a cascade.
🔹 Scenarios
1️⃣ Sweep then bounce: wick below 62k, quick recovery of the level
2️⃣ Clean breakdown: closes below 61–62k with volume, target 58k
3️⃣ 60–63k range: the market digests and the map rebuilds
👀 What to watch
• A volume bar > $120–150B on a test of 62k/61k = possible capitulation
• OI rising during the decline = new shorts, risk of continuation
• Long/short ratio falling back toward 2.4 without a price bounce = longs capitulating
⚠️ A heatmap is a modeled estimate, not a real order book. It shows where the price might get pulled, not whether it will go there.
💬 Your scenario: sweep and bounce, or slide toward 58k?
#Bitcoin #Liquidations
The heatmap (BTCUSDT Binance) shows a dominant pocket around 62k, almost at the current price. No notable cluster right at 60k.
🔹 Key levels
• ~62k: the largest concentration, currently being tested
• ~61k: second line, thinner, just below
• ~58k: intermediate level if 61–62k gives way
• ~51–52k: second major pocket, but far away (-18%)
• Above: little density between 65k and 80k, so little fuel for an upside squeeze
🔹 What Binance data shows
• Global OI ~ $26.9B (+1.3%), about -25% since the last peak: the cleanup has already begun
• $157.7M liquidated in 24h: notable, but not capitulation
• Top traders: about 75% of accounts are long, with a long/short ratio around 3
• Futures volume: $50–90B/day since mid-October, far from the panic peaks in August and October
👀 Our take
Long positioning + a large pocket just below the price = a classic liquidity-hunt setup. But moderate volume points more to a gradual flush than a cascade.
🔹 Scenarios
1️⃣ Sweep then bounce: wick below 62k, quick recovery of the level
2️⃣ Clean breakdown: closes below 61–62k with volume, target 58k
3️⃣ 60–63k range: the market digests and the map rebuilds
👀 What to watch
• A volume bar > $120–150B on a test of 62k/61k = possible capitulation
• OI rising during the decline = new shorts, risk of continuation
• Long/short ratio falling back toward 2.4 without a price bounce = longs capitulating
⚠️ A heatmap is a modeled estimate, not a real order book. It shows where the price might get pulled, not whether it will go there.
💬 Your scenario: sweep and bounce, or slide toward 58k?
#Bitcoin #Liquidations