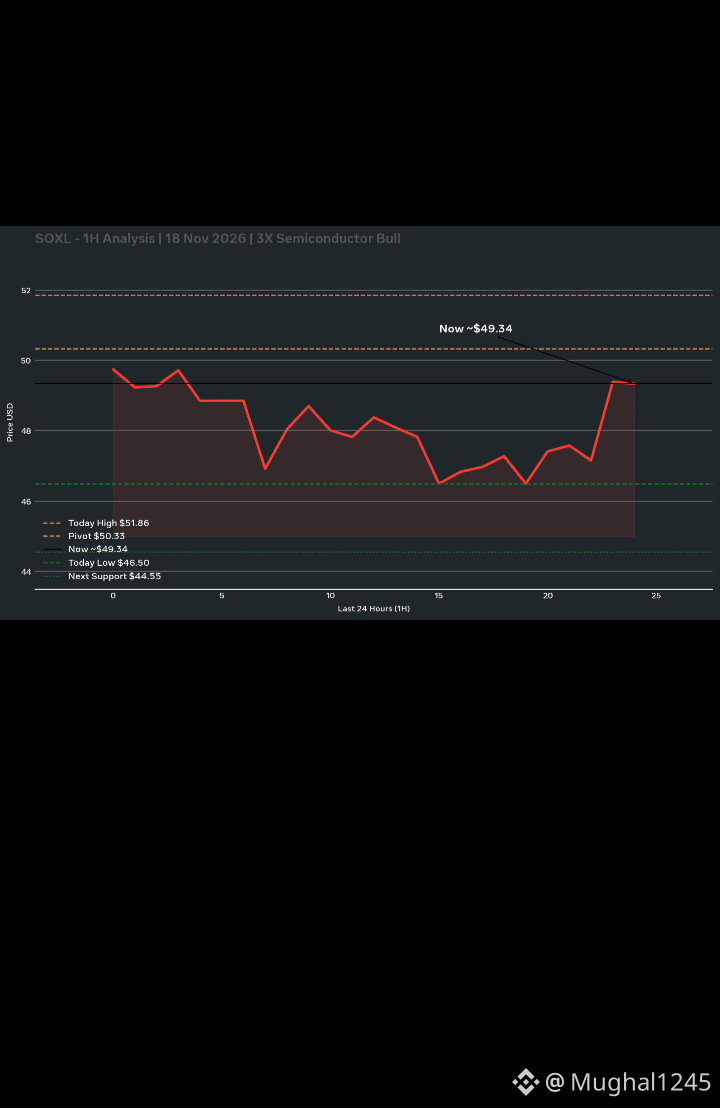
$SOXLB - Direxion Daily Semiconductor Bull 3X ETF | 1H Analysis*
- *Live Price:* ∼$49.34, +0.55% today. Open $51.24, High $51.86, Low $46.50
- *1H Bias:* *BEARISH* - All 4 timeframes bearish, evidence 95/100. 1H RSI 37.2, MACD negative
- *Perp version (SOXLB):* ∼$49.39, +2.03% in 24h, range $46.03 - $54.65, RSI 40.3, funding +0.0245% longs paying shorts 9d89c6c1317d
Level Price
Today High / Resistance \$51.86
Daily Pivot \$50.33
Current Price \$49.34
Today Low / Support 1 \$46.50
Next Support \$44.55
*What's happening:*
SOXL has fallen -49.98% in 1 month and -11.99% in 5 days. Today too, there was a -7.47% dump during the 10–11 hour, followed by a +6.15% bounce during the 3–4 hour. That means volatility is EXTREME - this is a 3X leveraged ETF, not like a normal stock. c6c1
A Three Black Crows pattern has formed on the 1H chart, which favors sellers. Price is below the daily pivot of $50.33 = an intraday seller lean.
*Scenario:*
- *Bearish:* If $49.34 fails to hold and $46.50 breaks, it could fall to $44.55 next, then $41.19 / $40.59.
- *Bullish:* If a 1H candle closes above $50.33, a short-term bounce to $51.86 is possible. The trend will only change above that.
*Warning:* SOXL is 3X, so a 1% SOX move = a 3% SOXL move. Don't hold overnight; decay eats away at it. Going long on the 1H is risky for now until $50.33 is reclaimed.
#CanNvidia’sDataCenterGrowthContinue? #LedgerHardwareImplantReportsExtendToDubai
- *Live Price:* ∼$49.34, +0.55% today. Open $51.24, High $51.86, Low $46.50
- *1H Bias:* *BEARISH* - All 4 timeframes bearish, evidence 95/100. 1H RSI 37.2, MACD negative
- *Perp version (SOXLB):* ∼$49.39, +2.03% in 24h, range $46.03 - $54.65, RSI 40.3, funding +0.0245% longs paying shorts 9d89c6c1317d
Level Price
Today High / Resistance \$51.86
Daily Pivot \$50.33
Current Price \$49.34
Today Low / Support 1 \$46.50
Next Support \$44.55
*What's happening:*
SOXL has fallen -49.98% in 1 month and -11.99% in 5 days. Today too, there was a -7.47% dump during the 10–11 hour, followed by a +6.15% bounce during the 3–4 hour. That means volatility is EXTREME - this is a 3X leveraged ETF, not like a normal stock. c6c1
A Three Black Crows pattern has formed on the 1H chart, which favors sellers. Price is below the daily pivot of $50.33 = an intraday seller lean.
*Scenario:*
- *Bearish:* If $49.34 fails to hold and $46.50 breaks, it could fall to $44.55 next, then $41.19 / $40.59.
- *Bullish:* If a 1H candle closes above $50.33, a short-term bounce to $51.86 is possible. The trend will only change above that.
*Warning:* SOXL is 3X, so a 1% SOX move = a 3% SOXL move. Don't hold overnight; decay eats away at it. Going long on the 1H is risky for now until $50.33 is reclaimed.
#CanNvidia’sDataCenterGrowthContinue? #LedgerHardwareImplantReportsExtendToDubai