🚀 $HYPE /USDT: Bullish rebound or bearish trap after support at $65.10? 📉📈
Take a look at the current $HYPE /USDT chart on the 15m and 1H timeframes. The asset has been experiencing a fairly volatile session, but there are key signals that active traders can't ignore:
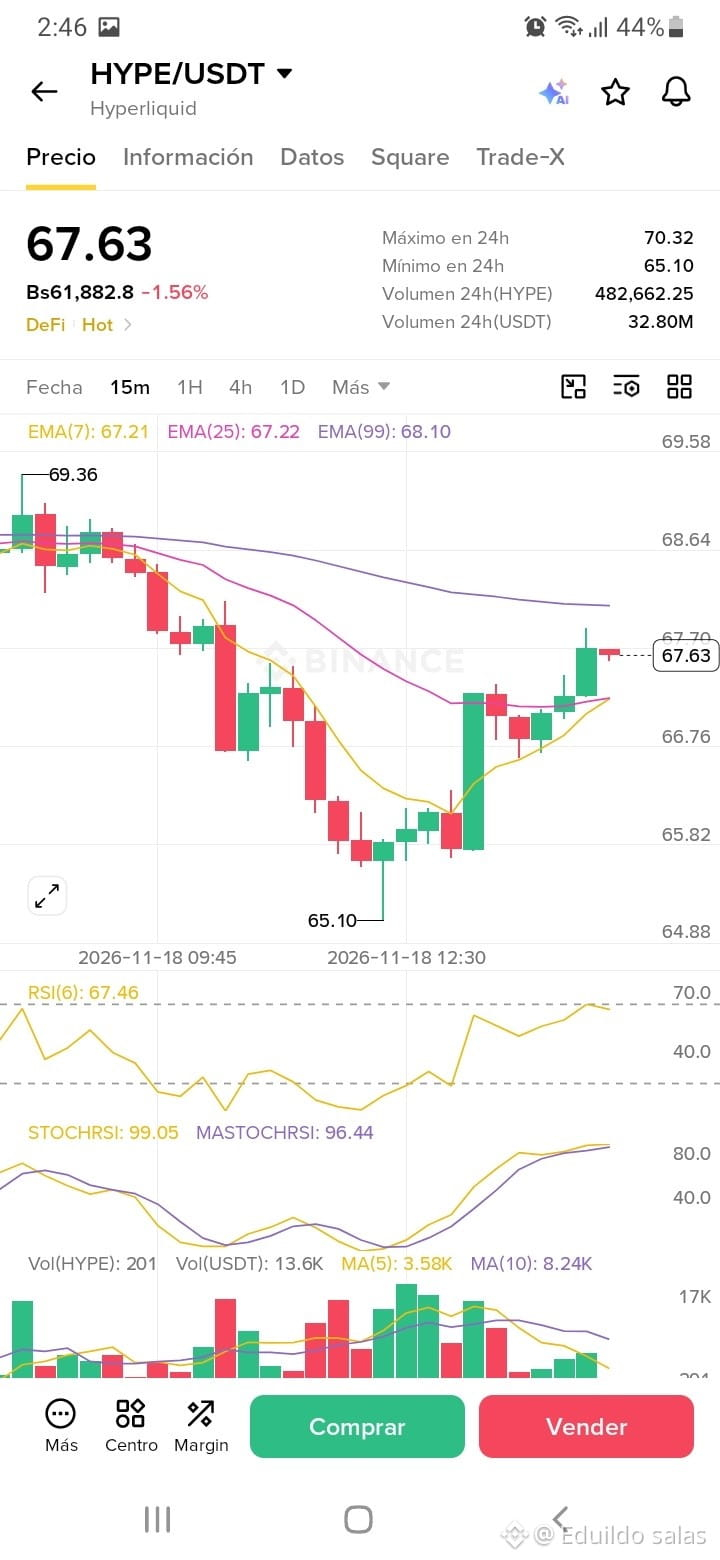
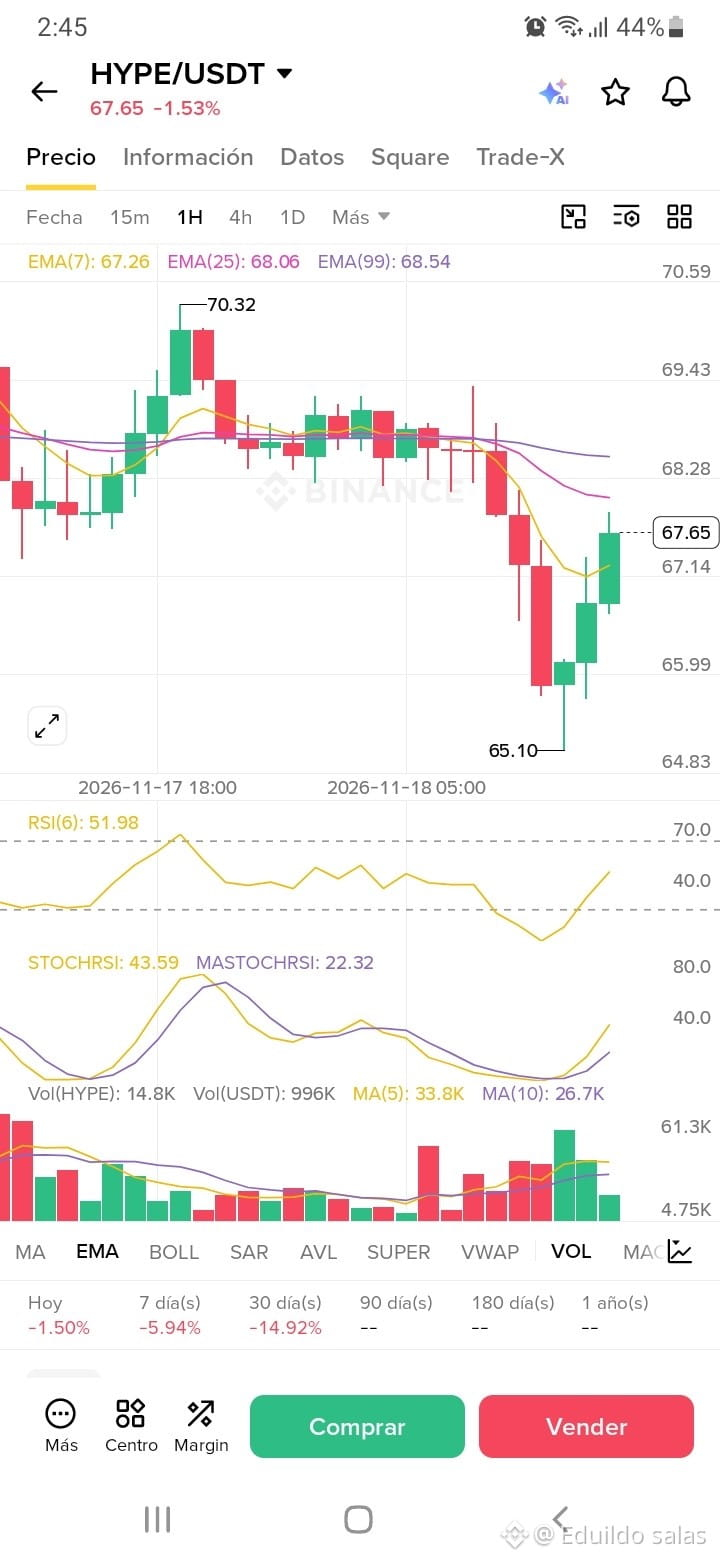
Test and Reaction at Key Support ($65.10): After a sharp drop from the $69.36 / $70.32 area, the price found a solid demand zone at $65.10, from which it staged a strong technical rebound, currently placing it above $67.63.
Crossovers and Moving Averages (EMA): On the 15-minute chart, the EMA(7) and EMA(25) lines have crossed upward, accompanying the recent momentum, although they still face resistance near the EMA(99) at 68.10, which is acting as the wall to break through to confirm a short-term trend reversal.
Momentum Indicators (RSI and StochRSI):
The RSI(6) on the 15m chart is hovering around 67.46, approaching the overbought zone.
The StochRSI shows elevated lines (99.05 / 96.44), warning of a possible pause or immediate consolidation before the next significant move.
💡 What should you watch now? If volume picks up and the price manages to break strongly through the $68.10 resistance, we could see a continuation pattern toward $69.50. Otherwise, a retest of intermediate support levels is likely.
Are you accumulating at this level, or would you rather wait for confirmation? Let me know what you think in the comments! 👇💬
#HYPE #BinanceSquare $GOOGLB #LedgerHardwareImplantReportsExtendToDubai
Take a look at the current $HYPE /USDT chart on the 15m and 1H timeframes. The asset has been experiencing a fairly volatile session, but there are key signals that active traders can't ignore:
Test and Reaction at Key Support ($65.10): After a sharp drop from the $69.36 / $70.32 area, the price found a solid demand zone at $65.10, from which it staged a strong technical rebound, currently placing it above $67.63.
Crossovers and Moving Averages (EMA): On the 15-minute chart, the EMA(7) and EMA(25) lines have crossed upward, accompanying the recent momentum, although they still face resistance near the EMA(99) at 68.10, which is acting as the wall to break through to confirm a short-term trend reversal.
Momentum Indicators (RSI and StochRSI):
The RSI(6) on the 15m chart is hovering around 67.46, approaching the overbought zone.
The StochRSI shows elevated lines (99.05 / 96.44), warning of a possible pause or immediate consolidation before the next significant move.
💡 What should you watch now? If volume picks up and the price manages to break strongly through the $68.10 resistance, we could see a continuation pattern toward $69.50. Otherwise, a retest of intermediate support levels is likely.
Are you accumulating at this level, or would you rather wait for confirmation? Let me know what you think in the comments! 👇💬
#HYPE #BinanceSquare $GOOGLB #LedgerHardwareImplantReportsExtendToDubai