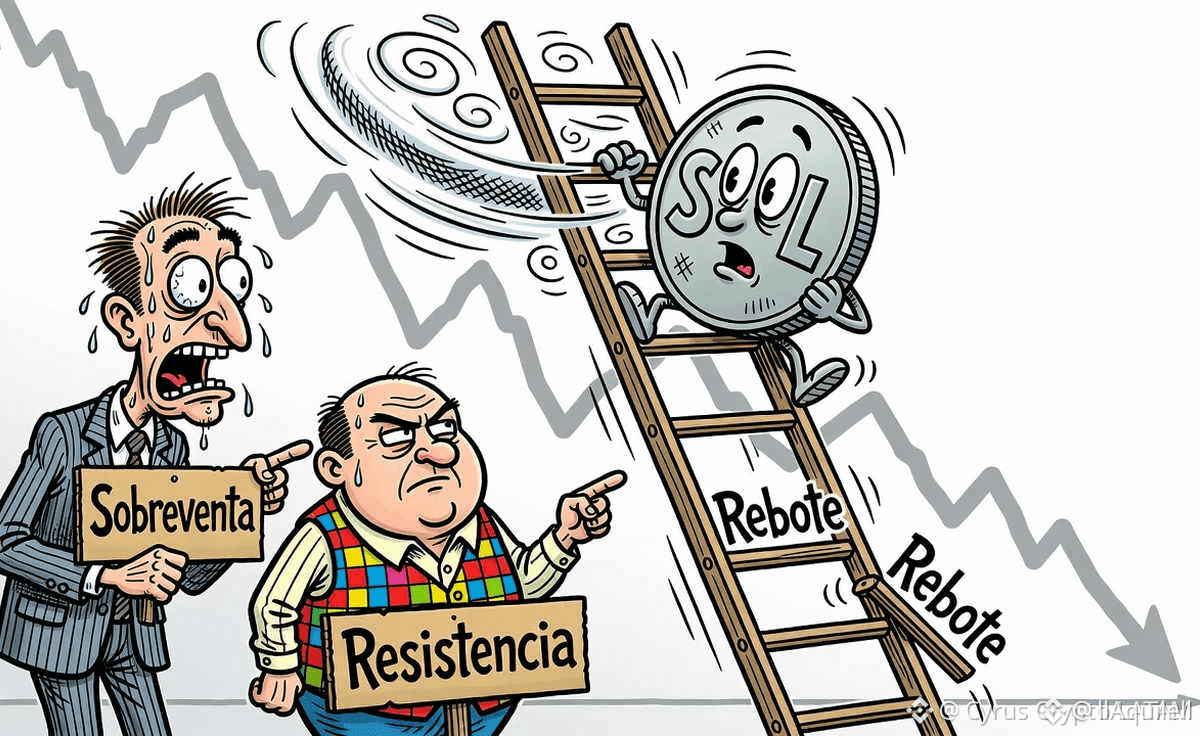
#solana Nov 18: Price under pressure and mixed technical signals
$SOL trades at USD $74.55 after retreating 0.45% from the previous close, while trend indicators remain tilted downward and the RSI is approaching oversold levels. Volume remains active, but there is insufficient data to attribute the move to liquidations, institutional flows, or a specific catalyst; these are the levels and scenarios to watch.
During the period covered by the data, SOL fell USD $0.34, from the previous close of USD $74.89 to USD $74.55; that amounts to a -0.45% change from the previous close. Intraday trading stayed within a range of USD $74.43 to USD $75.42, so the observed decline is limited and does not amount to a confirmed break below the daily low.
These initiatives are signs of business activity and development, but they do not replace verifiable data on users, fees, or protocol revenue.
Recommendation: HOLD (HOLD). The methodology considers five signals: structure relative to moving averages, MACD, RSI, position relative to VWAP, and volume versus the average. Three favor bearish caution: SOL is below its 7- to 200-day moving averages, the MACD is negative, and the low RSI signals selling pressure; two qualify that reading, since the price is holding above the SMA-5 and trading above intraday VWAP. Above-average volume confirms activity, but does not determine direction.
For the short term, a speculative entry could be scaled in between the USD $73.93 VWAP and the USD $72.97 SMA-5, only if the price holds those levels; a stop-loss below the 90-day low of USD $67.55 defines the risk, but implies a wide gap and should be adjusted to the position size. The first profit-taking target could be the USD $77.07 SMA-10 and a second the USD $82.65 SMA-15, provided the price reaches those levels and momentum supports the move.
#Binance
$SOL trades at USD $74.55 after retreating 0.45% from the previous close, while trend indicators remain tilted downward and the RSI is approaching oversold levels. Volume remains active, but there is insufficient data to attribute the move to liquidations, institutional flows, or a specific catalyst; these are the levels and scenarios to watch.
During the period covered by the data, SOL fell USD $0.34, from the previous close of USD $74.89 to USD $74.55; that amounts to a -0.45% change from the previous close. Intraday trading stayed within a range of USD $74.43 to USD $75.42, so the observed decline is limited and does not amount to a confirmed break below the daily low.
These initiatives are signs of business activity and development, but they do not replace verifiable data on users, fees, or protocol revenue.
Recommendation: HOLD (HOLD). The methodology considers five signals: structure relative to moving averages, MACD, RSI, position relative to VWAP, and volume versus the average. Three favor bearish caution: SOL is below its 7- to 200-day moving averages, the MACD is negative, and the low RSI signals selling pressure; two qualify that reading, since the price is holding above the SMA-5 and trading above intraday VWAP. Above-average volume confirms activity, but does not determine direction.
For the short term, a speculative entry could be scaled in between the USD $73.93 VWAP and the USD $72.97 SMA-5, only if the price holds those levels; a stop-loss below the 90-day low of USD $67.55 defines the risk, but implies a wide gap and should be adjusted to the position size. The first profit-taking target could be the USD $77.07 SMA-10 and a second the USD $82.65 SMA-15, provided the price reaches those levels and momentum supports the move.
#Binance