Is $MMTUSDT gearing up for another aggressive leg higher as it tests a major barrier? 👀
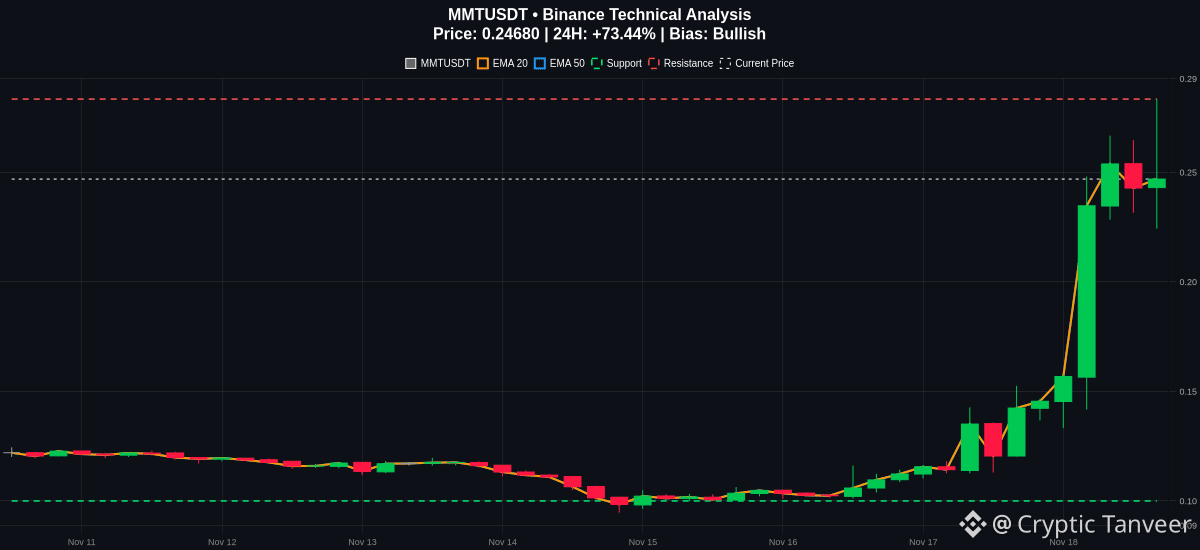
The chart shows a strong bullish trend structure with price currently trading at 0.2468, up over 73% in the last 24 hours.
The immediate resistance level sits at 0.2833. A clean push toward this zone could trigger continuation, but market participants should watch how price behaves near this ceiling.
Looking at the indicators, the technical setup reveals clear upward momentum. The MACD line at 0.0322 is well above the signal line at 0.0167, confirming strong buying pressure. Both the EMA20 at 0.1621 and EMA50 at 0.1362 are sloping upward nicely below current
prices.
However, the RSI is currently reading at 83.70, indicating elevated and overbought conditions. While this is not an automatic sell signal, being strongly extended above the EMA20 introduces potential pullback risk if momentum cools down.
Support is located down at 0.0999. Any aggressive breakdown below this invalidation level would heavily weaken the current bullish structure. Manage your risk carefully and avoid forcing trades without confirmation.
Are you taking profits near resistance or waiting for a breakout confirmation? Let me know your plan below.
#BinanceSquare #CryptoTrading #TechnicalAnalysis
Follow me for more update 🔔
The chart shows a strong bullish trend structure with price currently trading at 0.2468, up over 73% in the last 24 hours.
The immediate resistance level sits at 0.2833. A clean push toward this zone could trigger continuation, but market participants should watch how price behaves near this ceiling.
Looking at the indicators, the technical setup reveals clear upward momentum. The MACD line at 0.0322 is well above the signal line at 0.0167, confirming strong buying pressure. Both the EMA20 at 0.1621 and EMA50 at 0.1362 are sloping upward nicely below current
prices.
However, the RSI is currently reading at 83.70, indicating elevated and overbought conditions. While this is not an automatic sell signal, being strongly extended above the EMA20 introduces potential pullback risk if momentum cools down.
Support is located down at 0.0999. Any aggressive breakdown below this invalidation level would heavily weaken the current bullish structure. Manage your risk carefully and avoid forcing trades without confirmation.
Are you taking profits near resistance or waiting for a breakout confirmation? Let me know your plan below.
#BinanceSquare #CryptoTrading #TechnicalAnalysis
Follow me for more update 🔔