$BTC Crypto Market Academician: 11.19 Bitcoin (BTC)—the daily chart’s bearish moving-average alignment remains unchanged. Can a low-level four-hour golden cross end this decline?
After an oversold drop, it’s only natural to want to buy the dip. But a steep decline is never, by itself, a reason to buy; the structure needs to stabilize first. Right now, the four-hour green bars are narrowing, while the daily chart is still held down below the moving averages. This is a phase where both bulls and bears can trade, but neither has an easy time—and it’s especially easy to get caught on both sides. In this kind of market, I recommend reducing your trading frequency. It’s better to miss part of a rebound than to take a heavy directional position when signals are unclear. If you can’t stick to your stop-loss or get anxious as soon as you look at the chart, the best move is to wait on the sidelines for now. I’m doing the same
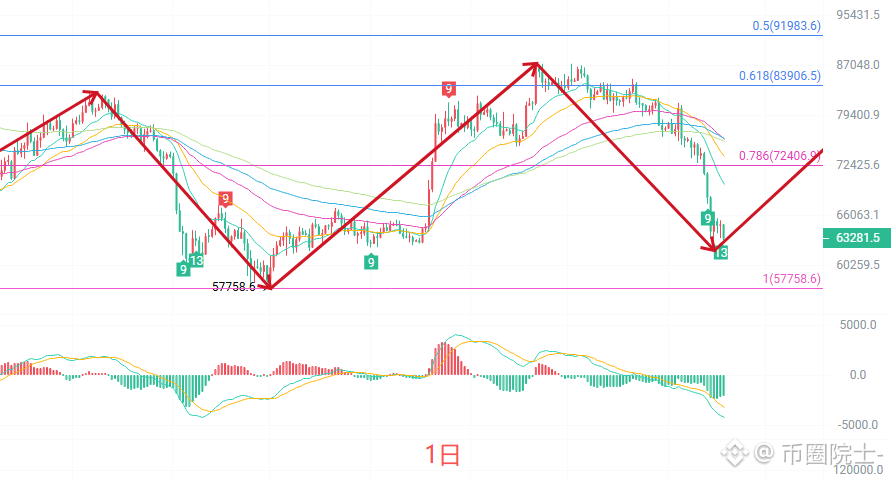
The daily K-line has pulled back from a rebound high around 81000, closing lower for several consecutive sessions. The latest daily candle has fallen below all short- and medium-term EMA lines, which are clearly aligned bearishly, with the price trading below them all. The MACD green bars continue to expand, so momentum remains bearish. After breaking below the Bollinger lower band at 62058, the price rebounded, but the bands as a whole are opening downward. The daily chart remains in a weak downtrend, with no clear signs yet that the rebound has stabilized.
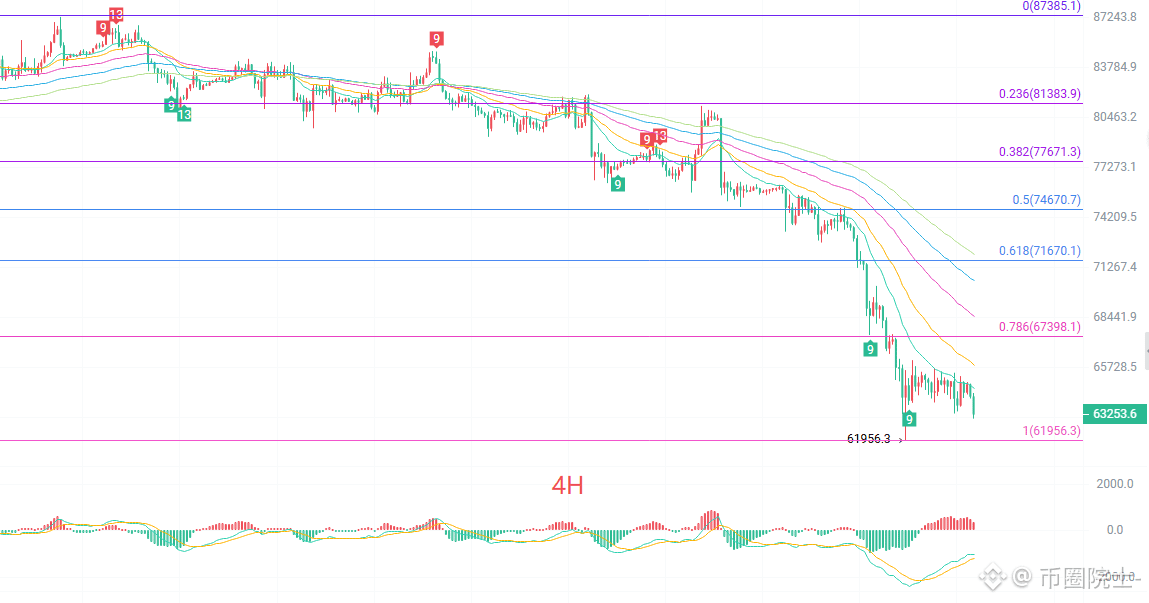
The four-hour K-line made a small rebound after reaching a previous low of 61950, but the rebound has been limited. The price is still being pressed down by the five-period EMA, while the short-term moving averages are clustered overhead and pointing down—a typical weak consolidation after a decline. The MACD green bars show signs of narrowing, but no golden cross has formed yet. The Bollinger lower band is at 63694, with the price tracking along it; the middle band at 65547 is the first resistance above. The four-hour chart is still in a bottoming-out observation phase. Until a reversal structure emerges, treat any rebound as a weak bounce.
Short-term reference:
Short: 64500 to 65000 if momentum stalls; stop-loss 500 points; target 64000 to 63000.
Long: 62500 to 62000 if the decline finds support; stop-loss 500 points; target 63500 to 84500.
For specific trades, rely on real-time order-book data. For more information, you can contact the author. Articles are published with a delay and are for reference only; assume all risks yourself.
#BTC走势分析
After an oversold drop, it’s only natural to want to buy the dip. But a steep decline is never, by itself, a reason to buy; the structure needs to stabilize first. Right now, the four-hour green bars are narrowing, while the daily chart is still held down below the moving averages. This is a phase where both bulls and bears can trade, but neither has an easy time—and it’s especially easy to get caught on both sides. In this kind of market, I recommend reducing your trading frequency. It’s better to miss part of a rebound than to take a heavy directional position when signals are unclear. If you can’t stick to your stop-loss or get anxious as soon as you look at the chart, the best move is to wait on the sidelines for now. I’m doing the same
The daily K-line has pulled back from a rebound high around 81000, closing lower for several consecutive sessions. The latest daily candle has fallen below all short- and medium-term EMA lines, which are clearly aligned bearishly, with the price trading below them all. The MACD green bars continue to expand, so momentum remains bearish. After breaking below the Bollinger lower band at 62058, the price rebounded, but the bands as a whole are opening downward. The daily chart remains in a weak downtrend, with no clear signs yet that the rebound has stabilized.
The four-hour K-line made a small rebound after reaching a previous low of 61950, but the rebound has been limited. The price is still being pressed down by the five-period EMA, while the short-term moving averages are clustered overhead and pointing down—a typical weak consolidation after a decline. The MACD green bars show signs of narrowing, but no golden cross has formed yet. The Bollinger lower band is at 63694, with the price tracking along it; the middle band at 65547 is the first resistance above. The four-hour chart is still in a bottoming-out observation phase. Until a reversal structure emerges, treat any rebound as a weak bounce.
Short-term reference:
Short: 64500 to 65000 if momentum stalls; stop-loss 500 points; target 64000 to 63000.
Long: 62500 to 62000 if the decline finds support; stop-loss 500 points; target 63500 to 84500.
For specific trades, rely on real-time order-book data. For more information, you can contact the author. Articles are published with a delay and are for reference only; assume all risks yourself.
#BTC走势分析