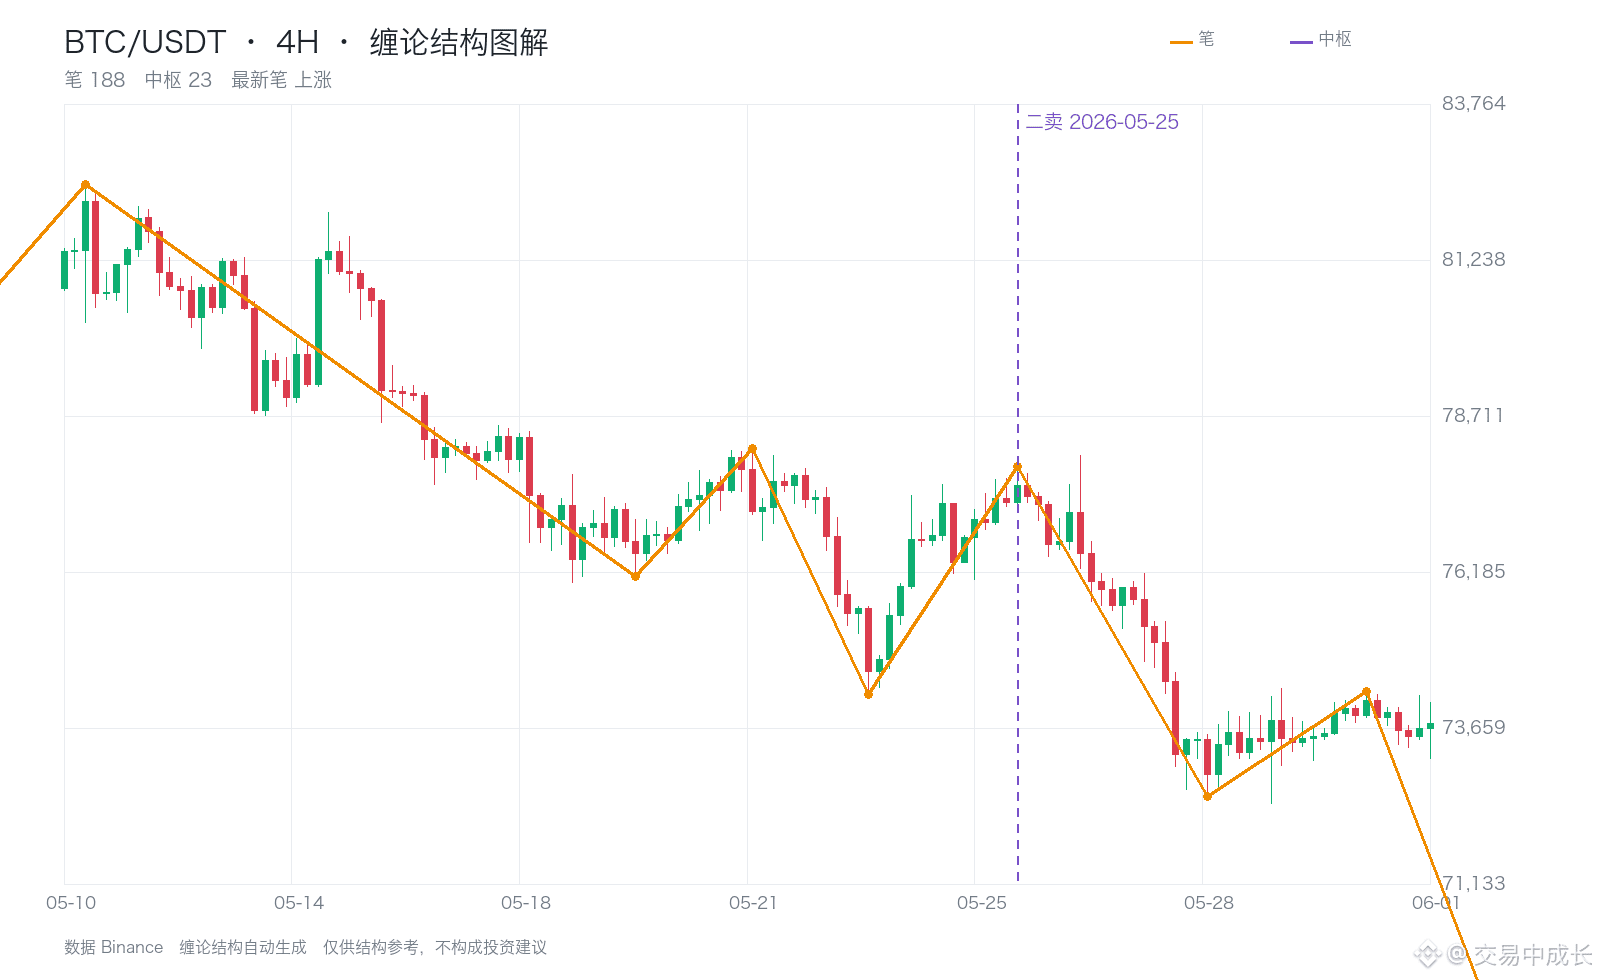
Review of a historical case: On May 25, 2026, the engine identified the 4-hour BTC structure as a second sell point.
The previous sell-point marker price for this signal was 78,180, and the marker price of 77,888 was below this reference price.
Over the following 20 candlesticks, the price fell as low as 72,556, with a maximum favorable move of 6.8% relative to the marker price. The window closed at 73,591.
When reviewing the trade, also consider the adverse price movement along the way—not just how much ground the price ultimately covered.
This is a retrospective structural review. The interval’s high and low prices are not the same as actual trading returns, and do not mean the signal could have been confirmed at the time.
$BTC $ETH #缠论 #比特币矿企 #ZcashETF
The previous sell-point marker price for this signal was 78,180, and the marker price of 77,888 was below this reference price.
Over the following 20 candlesticks, the price fell as low as 72,556, with a maximum favorable move of 6.8% relative to the marker price. The window closed at 73,591.
When reviewing the trade, also consider the adverse price movement along the way—not just how much ground the price ultimately covered.
This is a retrospective structural review. The interval’s high and low prices are not the same as actual trading returns, and do not mean the signal could have been confirmed at the time.
$BTC $ETH #缠论 #比特币矿企 #ZcashETF