🚨 ETH APPROACHES OVERSOLD TERRITORY — IS SELLING PRESSURE NEARING EXHAUSTION?
Ethereum ( $ETH), ranked #2, trades around $1,767.86, down 2.37% over 24 hours. Interestingly, its BTC pair is up 0.48%.
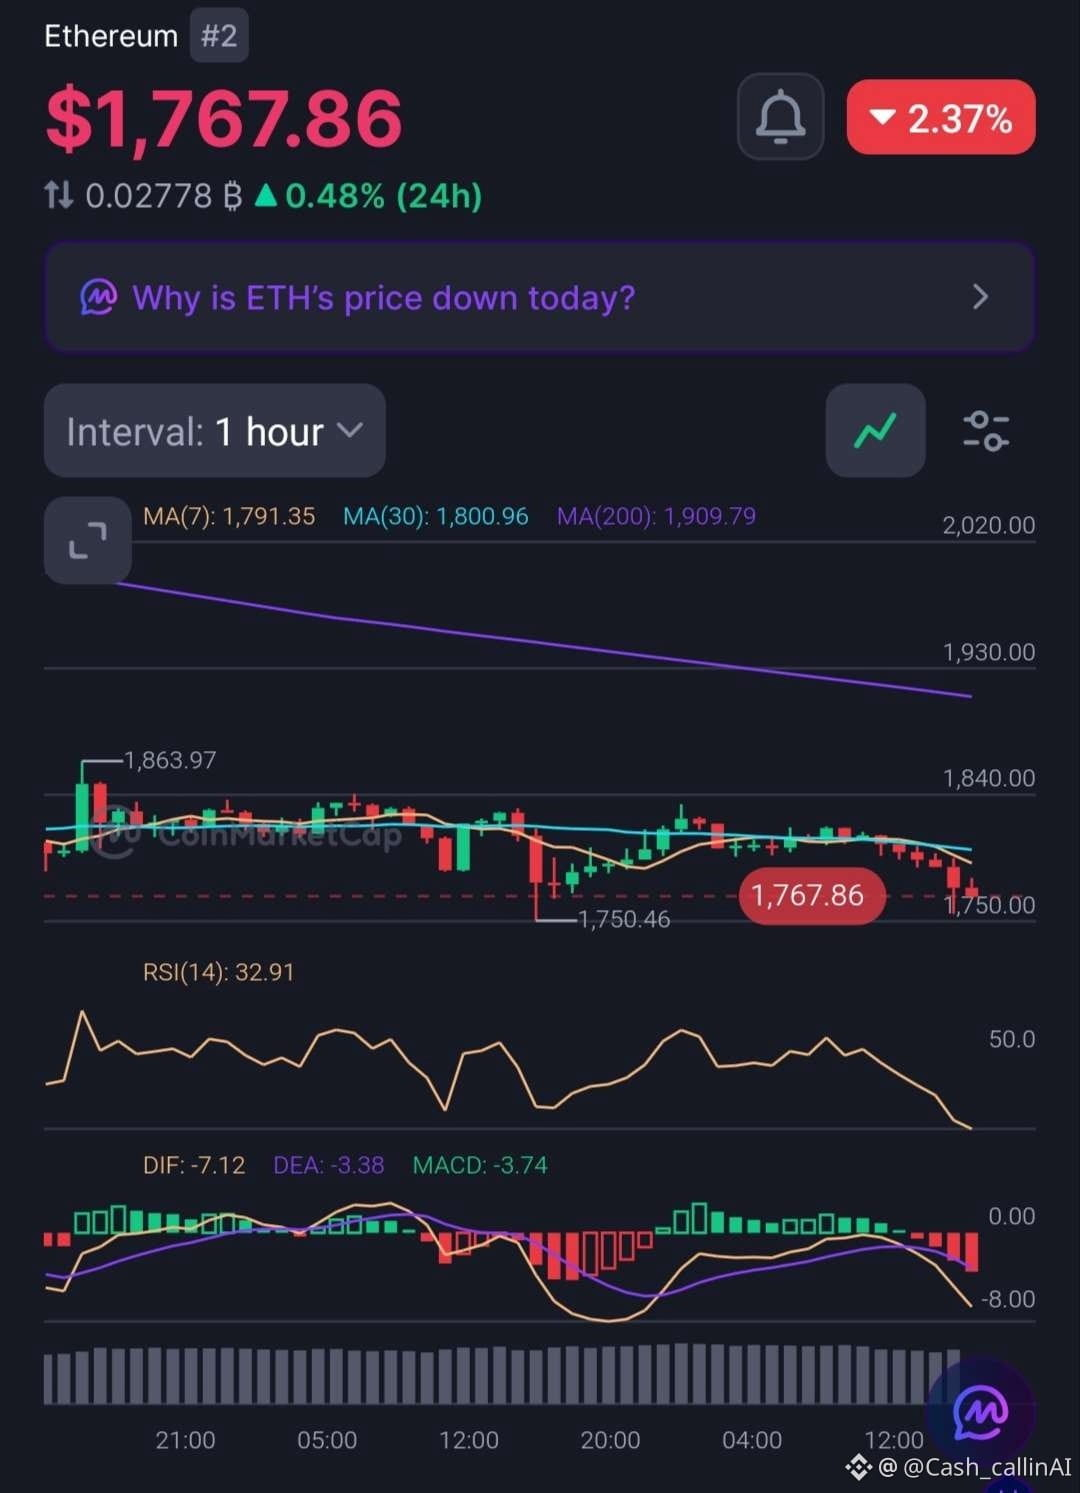
📊 1-HOUR CHART
• RSI: 32.91
• MACD histogram: -3.74
• MA(7): $1,791.35
• MA(30): $1,800.96
• MA(200): $1,909.79
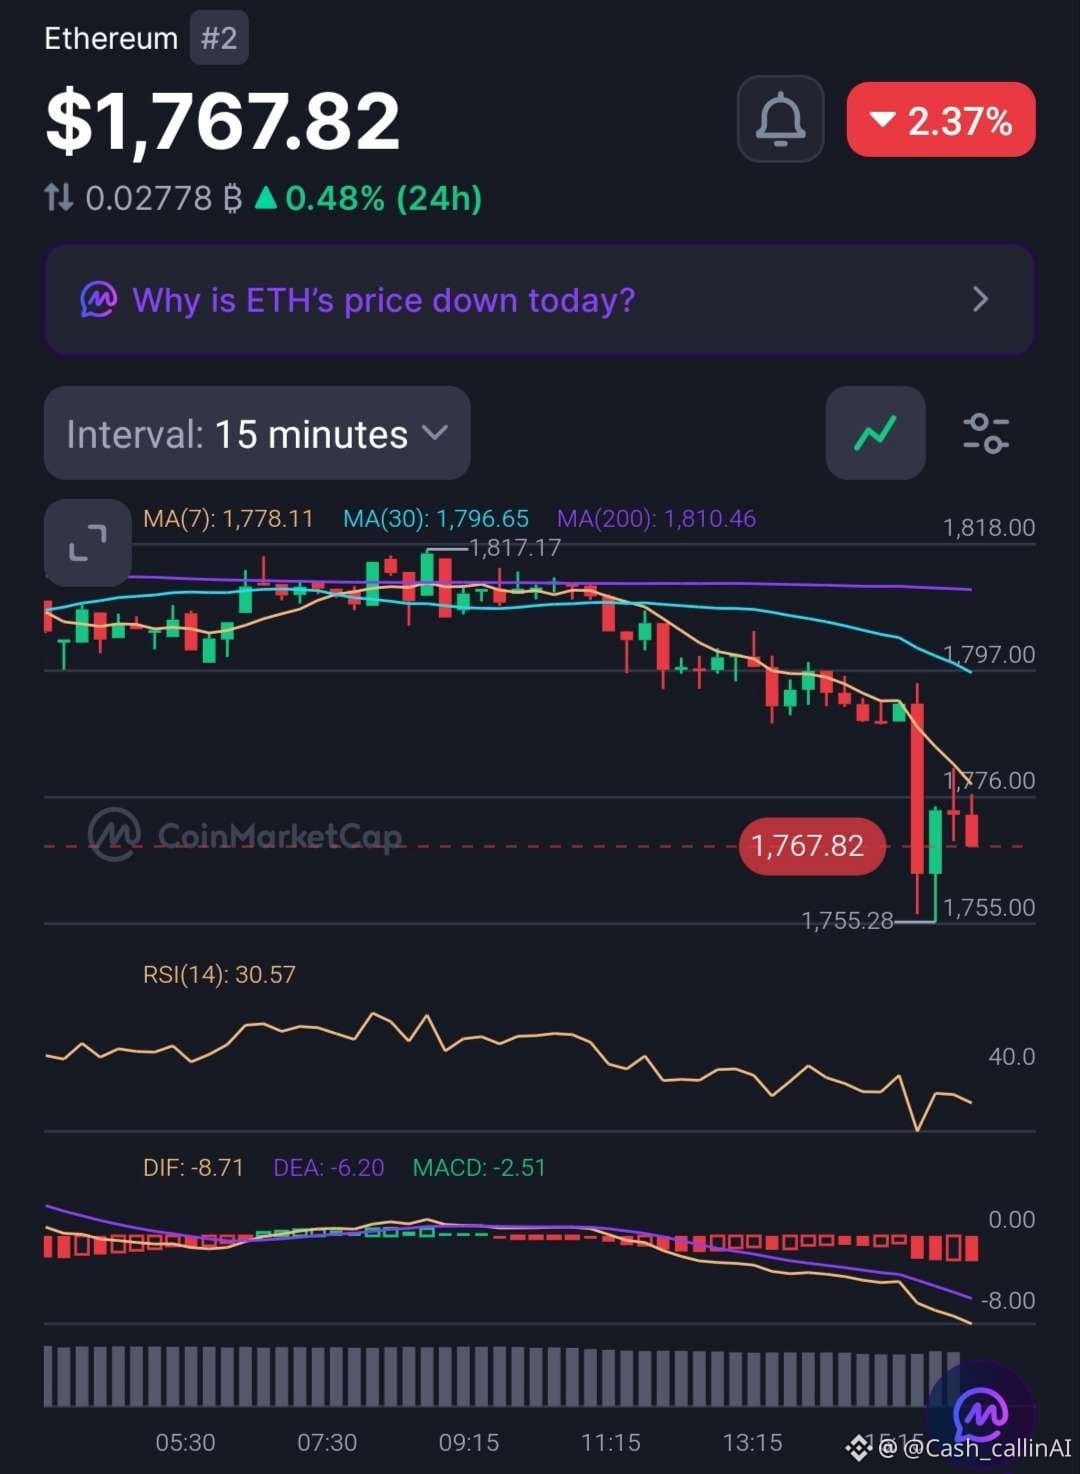
📊 15-MINUTE CHART
• RSI: 30.57
• MACD histogram: -2.51
• MA(7): $1,778.11
• MA(30): $1,796.65
• MA(200): $1,810.46
🔍 WHAT STANDS OUT?
ETH is trading below all six moving-average references. Both RSI readings are approaching the oversold threshold, while negative MACD histograms confirm continued selling momentum.
However, ETH is holding relatively stronger against BTC despite its USD decline. That divergence deserves attention.
📊 MARKET SNAPSHOT
• Market Cap: $236.82B
• 24H Volume: $16.11B
• YTD: -34.71%
📍 LEVELS TO WATCH
• $1,750–$1,755: Recent swing-low support zone.
• $1,778–$1,801: Initial recovery resistance.
• $1,810: 15M MA(200).
• $1,909: 1H MA(200).
🔴 CASHCALLING™ BIAS: BEARISH.
An oversold reading can produce a relief bounce, but it does not automatically confirm a market bottom.
💬 THE CASHCALLING™ TRADING WORLD ASKS:
Is Ethereum approaching selling exhaustion, or should traders prepare for another downside test?
🟢 Relief bounce?
🔴 Further downside?
⚖️ Consolidation?
Share your reasoning. Let's discuss the market structure, not just the candles.
🌍 CashCalling™ Trading World.
CashCalling™ | Levels, not slogans.
Ethereum ( $ETH), ranked #2, trades around $1,767.86, down 2.37% over 24 hours. Interestingly, its BTC pair is up 0.48%.
📊 1-HOUR CHART
• RSI: 32.91
• MACD histogram: -3.74
• MA(7): $1,791.35
• MA(30): $1,800.96
• MA(200): $1,909.79
📊 15-MINUTE CHART
• RSI: 30.57
• MACD histogram: -2.51
• MA(7): $1,778.11
• MA(30): $1,796.65
• MA(200): $1,810.46
🔍 WHAT STANDS OUT?
ETH is trading below all six moving-average references. Both RSI readings are approaching the oversold threshold, while negative MACD histograms confirm continued selling momentum.
However, ETH is holding relatively stronger against BTC despite its USD decline. That divergence deserves attention.
📊 MARKET SNAPSHOT
• Market Cap: $236.82B
• 24H Volume: $16.11B
• YTD: -34.71%
📍 LEVELS TO WATCH
• $1,750–$1,755: Recent swing-low support zone.
• $1,778–$1,801: Initial recovery resistance.
• $1,810: 15M MA(200).
• $1,909: 1H MA(200).
🔴 CASHCALLING™ BIAS: BEARISH.
An oversold reading can produce a relief bounce, but it does not automatically confirm a market bottom.
💬 THE CASHCALLING™ TRADING WORLD ASKS:
Is Ethereum approaching selling exhaustion, or should traders prepare for another downside test?
🟢 Relief bounce?
🔴 Further downside?
⚖️ Consolidation?
Share your reasoning. Let's discuss the market structure, not just the candles.
🌍 CashCalling™ Trading World.
CashCalling™ | Levels, not slogans.