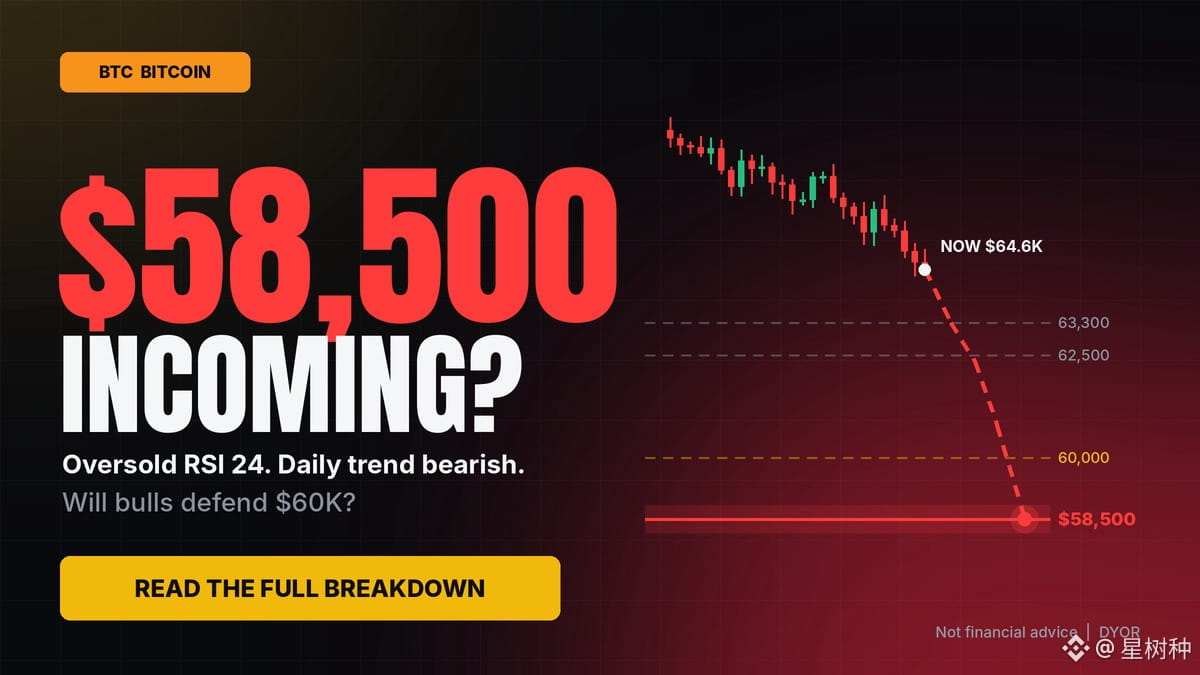
📉 $58,500 INCOMING? IS BITCOIN PREPARING FOR ANOTHER LEG DOWN?
Bitcoin is hovering around $64,000–$65,000, but the broader technical picture remains under pressure.
The question is no longer whether the market is nervous. The question is whether buyers can defend the next important support zones.
🔎 THE TECHNICAL BREAKDOWN
1. Market structure
Daily trend remains bearish.
Lower highs indicate continued selling pressure.
Bitcoin remains below major moving averages.
RSI near 24 signals oversold conditions, but does not confirm a bottom.
2. Critical support levels
$63,300 — Immediate support.
$62,500 — Next downside level.
$60,000 — Major psychological support.
$58,500 — Key monthly chart support.
3. What could trigger $58,500?
A confirmed daily breakdown below $62,500, followed by failure to reclaim $60,000, would increase the probability of a move towards $58,500.
4. What invalidates the bearish scenario?
A sustained recovery above $66,000, followed by stronger buying volume, could signal that sellers are losing control.
🎯 MY MARKET OUTLOOK $BTC
Bearish scenario: $58,500–$60,000.
Consolidation scenario: $62,000–$66,000.
Recovery scenario: $68,000–$70,000.
THE BIGGER PICTURE
Oversold markets can bounce violently. However, a bounce does not automatically mean a trend reversal.
Smart traders should watch confirmation, liquidity and volume rather than trying to predict the exact bottom.
IS $58,500 NEXT, OR WILL THE BULLS DEFEND $60K?
Share your BTC target below.
#Bitcoin #BTC #CryptoAnalysis #BinanceSquare #BitcoinPrediction
Bitcoin is hovering around $64,000–$65,000, but the broader technical picture remains under pressure.
The question is no longer whether the market is nervous. The question is whether buyers can defend the next important support zones.
🔎 THE TECHNICAL BREAKDOWN
1. Market structure
Daily trend remains bearish.
Lower highs indicate continued selling pressure.
Bitcoin remains below major moving averages.
RSI near 24 signals oversold conditions, but does not confirm a bottom.
2. Critical support levels
$63,300 — Immediate support.
$62,500 — Next downside level.
$60,000 — Major psychological support.
$58,500 — Key monthly chart support.
3. What could trigger $58,500?
A confirmed daily breakdown below $62,500, followed by failure to reclaim $60,000, would increase the probability of a move towards $58,500.
4. What invalidates the bearish scenario?
A sustained recovery above $66,000, followed by stronger buying volume, could signal that sellers are losing control.
🎯 MY MARKET OUTLOOK $BTC
Bearish scenario: $58,500–$60,000.
Consolidation scenario: $62,000–$66,000.
Recovery scenario: $68,000–$70,000.
THE BIGGER PICTURE
Oversold markets can bounce violently. However, a bounce does not automatically mean a trend reversal.
Smart traders should watch confirmation, liquidity and volume rather than trying to predict the exact bottom.
IS $58,500 NEXT, OR WILL THE BULLS DEFEND $60K?
Share your BTC target below.
#Bitcoin #BTC #CryptoAnalysis #BinanceSquare #BitcoinPrediction