📊 $SXT USDT – Bulls Trying to Take Control? 🐂
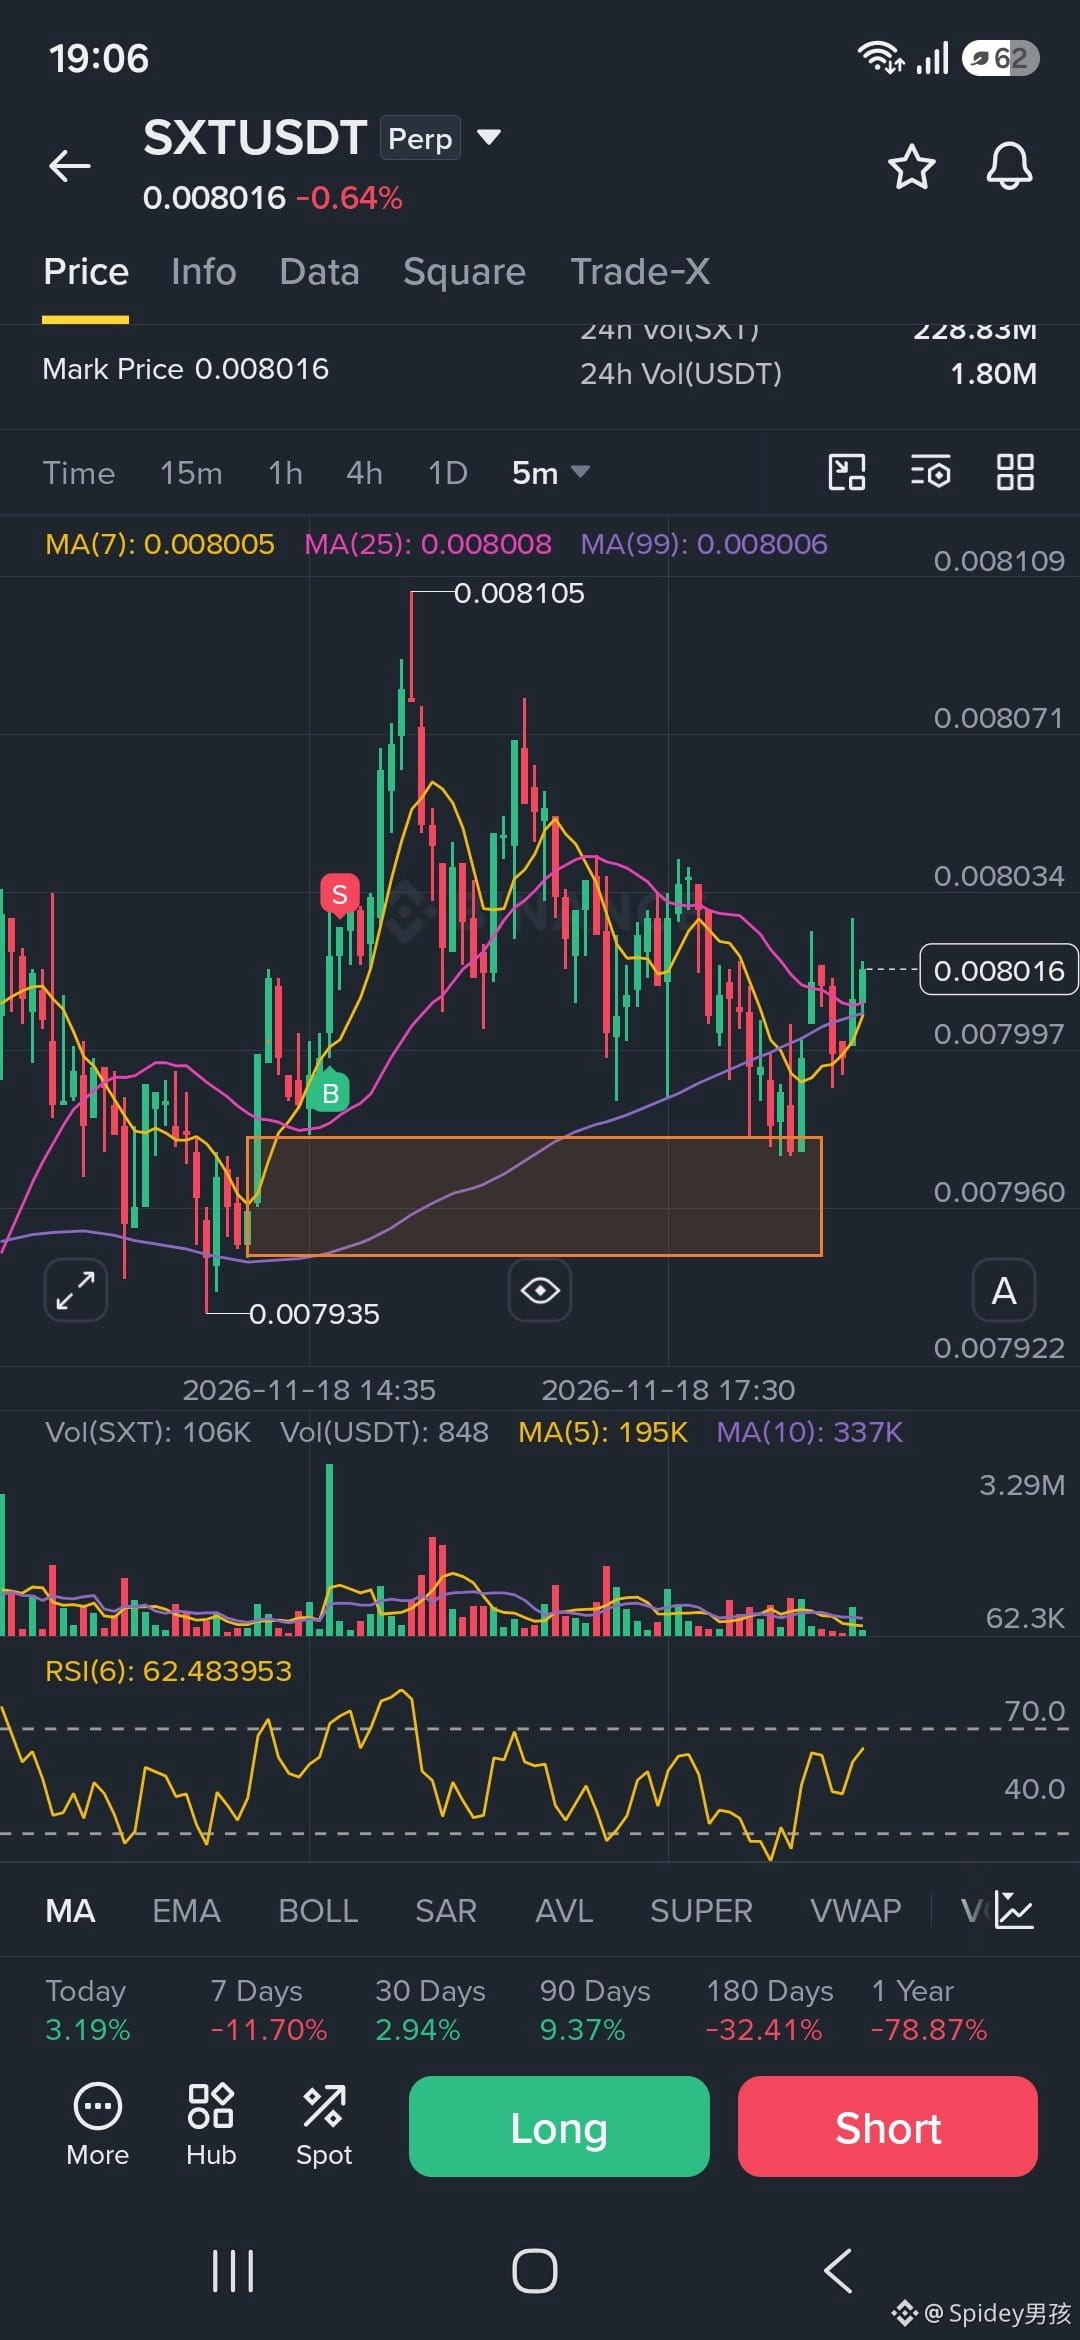
SXT is showing signs of a short-term recovery on the 5-minute chart after bouncing from the 0.007935–0.007970 demand zone.
🔍 Technical Breakdown:
- Current Price: 0.008016
- Support Zone: 0.007935–0.007970
- Immediate Resistance: 0.008034
- Next Resistance: 0.008071–0.008105
- RSI (6): 62.48 – bullish short-term momentum
- MA(7), MA(25), MA(99): Price is trading around all three moving averages.
🐂 Bullish Scenario:
If buyers maintain momentum and break above 0.008034 with strong volume, we could see a move toward 0.008071 and potentially 0.008105.
🐻 Bearish Scenario:
If price gets rejected near resistance and loses 0.007970, another retest of the demand zone around 0.007935 becomes possible.
My Take: Buyers are showing some strength, but confirmation is still needed. I'll be watching the resistance breakout and volume before considering the next move.
⚠️ Trade carefully. Always manage your risk and use proper stop-loss levels. This is technical analysis, not financial advice.
#SXTSignal #SXTUSDT #sxtusdt @SpaceandTime
SXT is showing signs of a short-term recovery on the 5-minute chart after bouncing from the 0.007935–0.007970 demand zone.
🔍 Technical Breakdown:
- Current Price: 0.008016
- Support Zone: 0.007935–0.007970
- Immediate Resistance: 0.008034
- Next Resistance: 0.008071–0.008105
- RSI (6): 62.48 – bullish short-term momentum
- MA(7), MA(25), MA(99): Price is trading around all three moving averages.
🐂 Bullish Scenario:
If buyers maintain momentum and break above 0.008034 with strong volume, we could see a move toward 0.008071 and potentially 0.008105.
🐻 Bearish Scenario:
If price gets rejected near resistance and loses 0.007970, another retest of the demand zone around 0.007935 becomes possible.
My Take: Buyers are showing some strength, but confirmation is still needed. I'll be watching the resistance breakout and volume before considering the next move.
⚠️ Trade carefully. Always manage your risk and use proper stop-loss levels. This is technical analysis, not financial advice.
#SXTSignal #SXTUSDT #sxtusdt @SpaceandTime