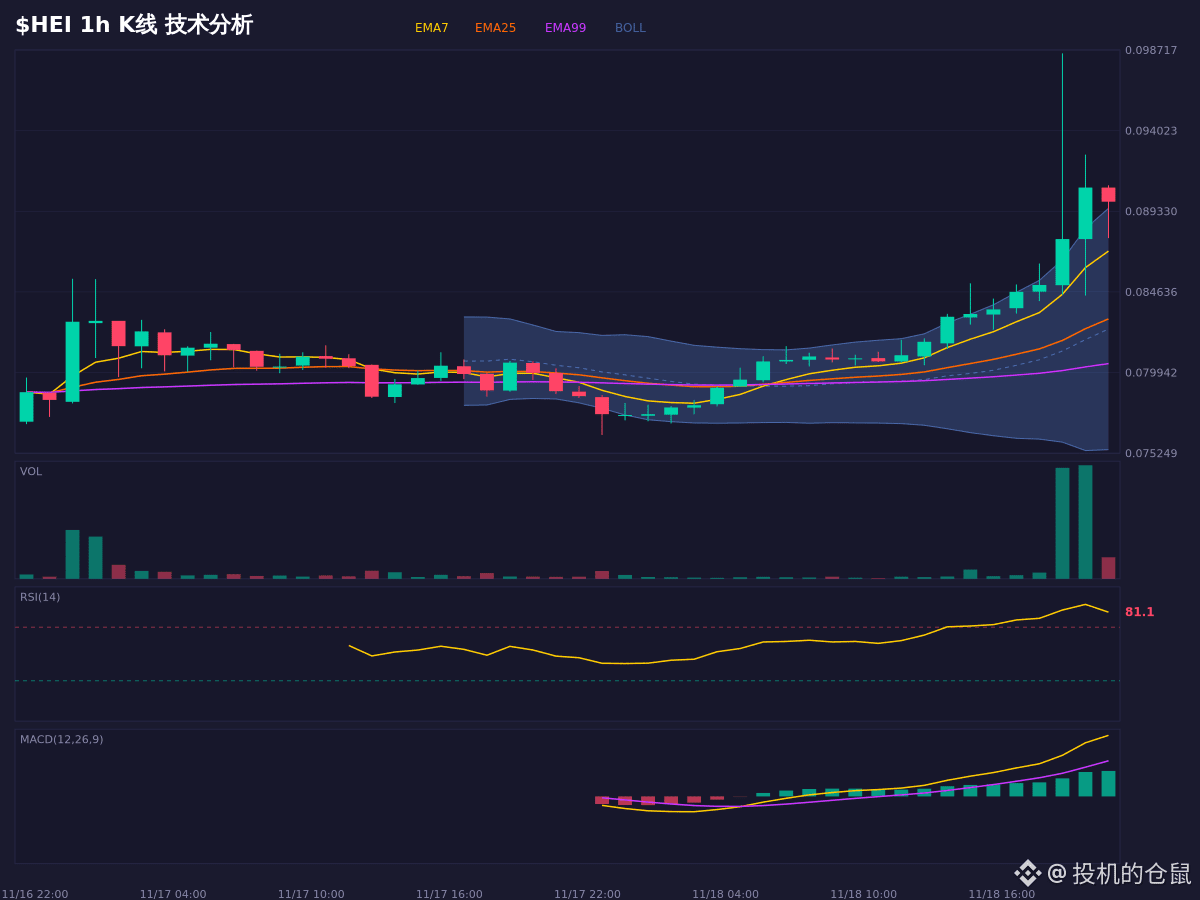
$HEI Daily chart shows a bullish alignment, with EMA7/EMA25/EMA99 forming a perfect bullish pattern. The price has broken above the upper Bollinger Band, indicating a strong trend. However, RSI at 81.9 is severely overbought, posing a high risk of a short-term pullback. Bullish momentum in MACD is increasing, and continued inflows shown by OBV support a still-bullish medium-term trend. The negative funding rate of -0.1432% indicates crowded short positions, creating the potential for a short squeeze. If price holds above the 0.090 support, the bullish structure may continue; if it falls below the key level of 0.0816, the current outlook is invalidated. Chasing the price carries high risk; consider waiting for a confirmed pullback before taking action. Market sentiment is elevated, so be alert to corrective pressure from an overbought pullback. For market observation and conditional analysis only; this does not constitute a record of trading activity.
$HEI #牛市 #交易 #Spot
$HEI #牛市 #交易 #Spot