📉 Is Bitcoin repeating history? Cycles worth noticing.
This chart reveals an interesting pattern:
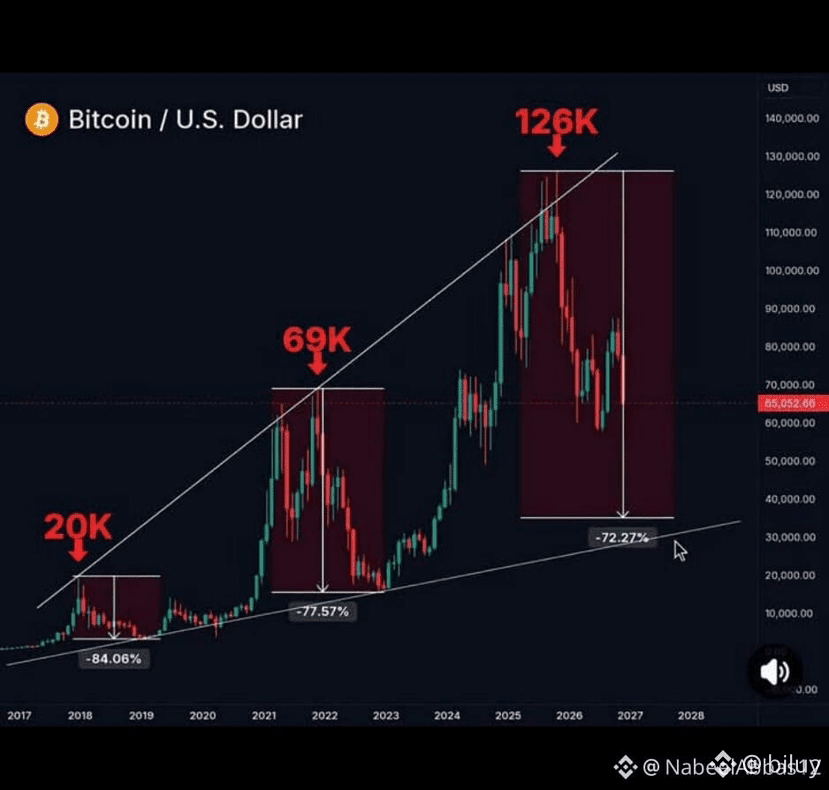
🔸 2017–2018: after peaking at $20,000, BTC fell by approximately 84%.
🔸 2021–2022: after reaching $69,000, the correction was about 77%.
🔸 2025–2026: after reaching $126,000, the chart shows a potential correction of approximately 72%.
It’s noticeable that the depth of the decline is gradually decreasing.
Could this mean that each subsequent bear cycle will be less painful?
Of course, history doesn’t guarantee that the scenario will repeat, but this pattern is worth paying attention to.
💬 We’d love to hear what you think:
Do you believe Bitcoin is already approaching the bottom of this cycle, or is another major drop still ahead?
#bitcoin #btc70k #AnthropicIPOPriceCouldExceed$80 #BitcoinAnalysis" #BitcoinAnalysis
This chart reveals an interesting pattern:
🔸 2017–2018: after peaking at $20,000, BTC fell by approximately 84%.
🔸 2021–2022: after reaching $69,000, the correction was about 77%.
🔸 2025–2026: after reaching $126,000, the chart shows a potential correction of approximately 72%.
It’s noticeable that the depth of the decline is gradually decreasing.
Could this mean that each subsequent bear cycle will be less painful?
Of course, history doesn’t guarantee that the scenario will repeat, but this pattern is worth paying attention to.
💬 We’d love to hear what you think:
Do you believe Bitcoin is already approaching the bottom of this cycle, or is another major drop still ahead?
#bitcoin #btc70k #AnthropicIPOPriceCouldExceed$80 #BitcoinAnalysis" #BitcoinAnalysis