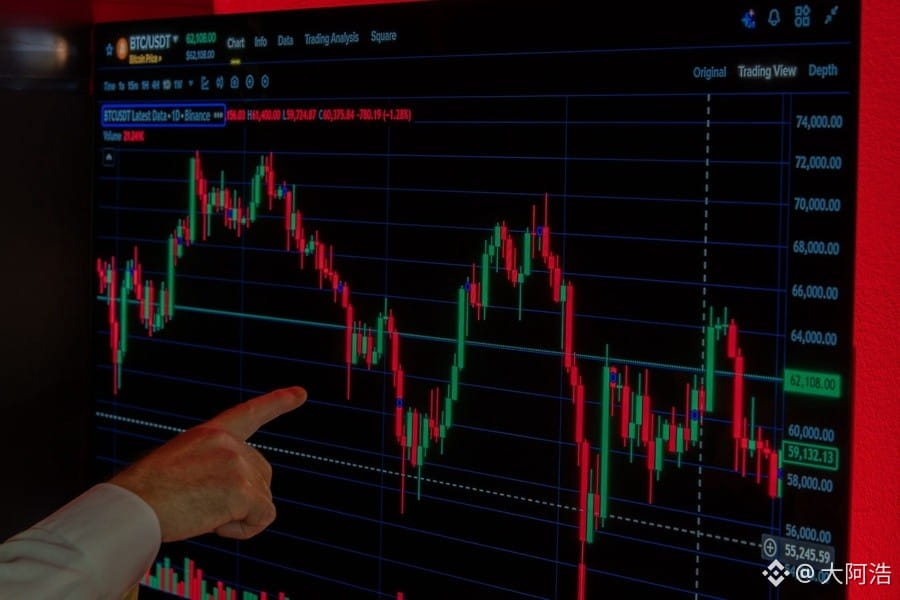
Looking at the data dashboard tonight, two of the most authoritative on-chain firms have come to exactly opposite conclusions.
On one side is Glassnode’s Tuesday report: realized losses locked in by investors selling coins have climbed to levels seen only at a handful of historic bottoms—in 2018, 2020, 2022, and early 2023. From November 13 to 14, long liquidations relative to open interest hit their highest level since 2023; more than $2 billion was liquidated over the weekend. Most importantly, there’s the buying activity: during the two most brutal days of selling, buyers absorbed about 66,000 $BTC in the $62,000–$66,000 range. On Binance and Coinbase, buy orders within 5% of the current price outnumbered sell orders by 2.3 to 1. The Coinbase premium even briefly turned positive at the lows, suggesting that U.S. buyers really did step in.
On the other side is CryptoQuant’s reality check: Bitcoin has re-entered a bear-market phase. Its analyst sentiment index is at its most pessimistic level since November 2025, while network-wide demand growth is contracting at its fastest pace since July 1. It acknowledges that $62,000–$65,000 is a support zone, but explicitly says current indicators cannot confirm a bottom.
The flow data isn’t exactly encouraging either: U.S. spot Bitcoin ETFs saw net outflows of $239.9 million on Tuesday, including $209.5 million from BlackRock’s IBIT alone. After eight straight days of outflows, they caught their breath for just one day before outflows resumed. The Fear & Greed Index read 11 this morning: extreme fear.
These two sets of data aren’t actually contradictory. The difference comes down to one thing: capitulation means “selling pressure has run out”—a passive signal. A bottom means “new buyers are consistently coming in”—an active signal. We’ve seen evidence of the former, but not the latter.
For now, it’s enough to watch three confirmation signals: whether ETF outflows keep narrowing, whether stablecoin supply stops falling and starts rising, and whether buy orders continue to absorb selling when the $62,000 level is tested. If all three turn positive, the bottom will have formed on its own. If only one does, it’s still just a bounce in a downtrend.
Which side do you believe: has selling pressure run its course, or has demand yet to return? Share the reasoning behind your view in the comments.
This article is for informational purposes only and does not constitute investment advice.
Sources: Glassnode weekly report (November 17); CryptoQuant analyst report; Farside Investors ETF flow data; Coindaro market roundup (November 18).
On one side is Glassnode’s Tuesday report: realized losses locked in by investors selling coins have climbed to levels seen only at a handful of historic bottoms—in 2018, 2020, 2022, and early 2023. From November 13 to 14, long liquidations relative to open interest hit their highest level since 2023; more than $2 billion was liquidated over the weekend. Most importantly, there’s the buying activity: during the two most brutal days of selling, buyers absorbed about 66,000 $BTC in the $62,000–$66,000 range. On Binance and Coinbase, buy orders within 5% of the current price outnumbered sell orders by 2.3 to 1. The Coinbase premium even briefly turned positive at the lows, suggesting that U.S. buyers really did step in.
On the other side is CryptoQuant’s reality check: Bitcoin has re-entered a bear-market phase. Its analyst sentiment index is at its most pessimistic level since November 2025, while network-wide demand growth is contracting at its fastest pace since July 1. It acknowledges that $62,000–$65,000 is a support zone, but explicitly says current indicators cannot confirm a bottom.
The flow data isn’t exactly encouraging either: U.S. spot Bitcoin ETFs saw net outflows of $239.9 million on Tuesday, including $209.5 million from BlackRock’s IBIT alone. After eight straight days of outflows, they caught their breath for just one day before outflows resumed. The Fear & Greed Index read 11 this morning: extreme fear.
These two sets of data aren’t actually contradictory. The difference comes down to one thing: capitulation means “selling pressure has run out”—a passive signal. A bottom means “new buyers are consistently coming in”—an active signal. We’ve seen evidence of the former, but not the latter.
For now, it’s enough to watch three confirmation signals: whether ETF outflows keep narrowing, whether stablecoin supply stops falling and starts rising, and whether buy orders continue to absorb selling when the $62,000 level is tested. If all three turn positive, the bottom will have formed on its own. If only one does, it’s still just a bounce in a downtrend.
Which side do you believe: has selling pressure run its course, or has demand yet to return? Share the reasoning behind your view in the comments.
This article is for informational purposes only and does not constitute investment advice.
Sources: Glassnode weekly report (November 17); CryptoQuant analyst report; Farside Investors ETF flow data; Coindaro market roundup (November 18).