ETH at $1,800—can you still hold on?
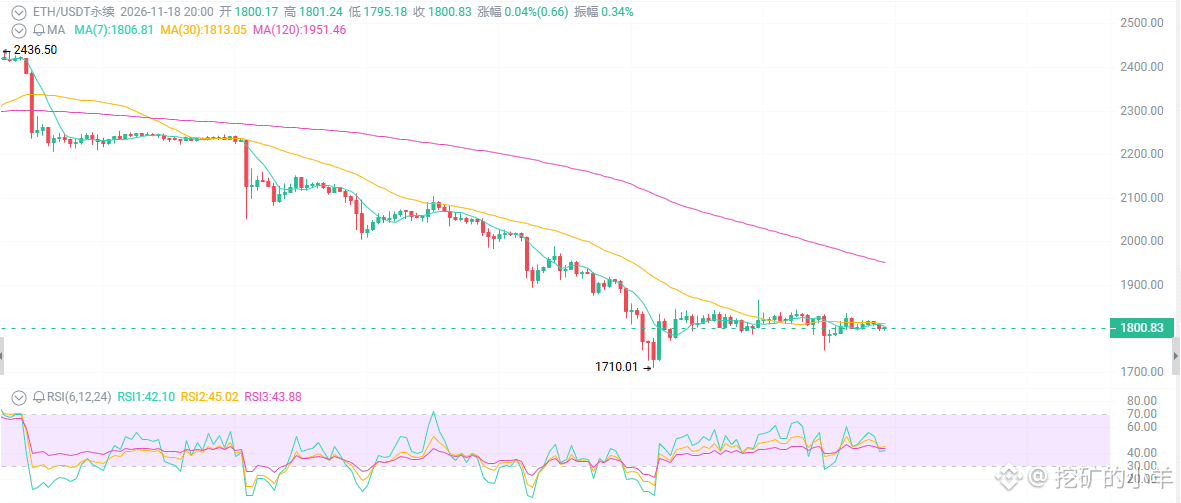
You rode it down from $2,500 to $1,800. Has your account been cut in half? ETFs have seen $760 million in outflows, the upgrade is delayed, but RSI has already fallen to 25—is this a golden buying opportunity or a bottomless pit?
Back in October, ETH was still at $2,500, and you thought, “If I just hold on a little longer, I’ll break even.”
Now it’s at $1,800. Your account is down nearly 30%. The first thing you do every day when you open the app is check whether it has bounced, then quietly close it.
What stings even more is that every news story you see tells you the same thing: ETFs are seeing outflows, institutions are pulling back, and ETH is finished.
First: ETFs are seeing outflows, but what’s fleeing isn’t “faith”—it’s “interest rates”
U.S. spot ETH ETFs saw $399 million in net outflows last week, with November’s total topping $760 million. BlackRock’s ETHA accounted for most of the outflows.
Sounds scary?
But look closer—cumulative net inflows are still at $14 billion. Institutions aren’t liquidating everything and leaving; they’re reducing their positions to hedge risk.
Why hedge?
The 10-year U.S. Treasury yield is 5.15%, while staking ETH earns you only 2.4% to 2.6% a year.
For the same kind of “easy money,” Treasuries are twice as attractive as ETH staking.
It’s not that ETH has lost its appeal; Treasuries are just that attractive. Capital hasn’t betrayed you—it’s turned away from the yield.
Second: The upgrade delay isn’t bearish—it’s about “expectations being priced in too far”
The Glamsterdam upgrade is expected in late 2026 or early 2027, but EIP-8037/8038 could affect up to 15,000 contracts. Developers are still debating, and there’s a risk of further delays.
Does hearing “delay” make you panic? Did ETH go up when the Pectra upgrade went live?
No. The good news was already priced in, and the price fell instead.
An upgrade going live can be a “sell the news” moment; a delay can be a buying opportunity as expectations are repriced. The market had already priced in an “upgrade by year-end.” Now that it’s delayed, the excess froth is being squeezed out.
Third: The technicals are deeply oversold, but “oversold” doesn’t mean “bottomed out”
The daily RSI is at 25 to 28—deeply oversold. Historically, this is often where a bounce begins.
But the price is well below the 20/50/100/200 EMAs. The 20 EMA is at 2,040 to 2,050, while the longer-term moving averages are above 2,200. The moving averages are in a bearish alignment; the trend hasn’t changed.
Support: 1,750 to 1,760 (24-hour low), 1,710 to 1,720 (structural support), then 1,600 to 1,650
Resistance: 1,830 to 1,850 (intraday high + short-term moving averages), 1,900 to 2,000 (psychological level + former support turned resistance), then 2,100 to 2,200
An oversold RSI is like a spring compressed all the way down—but that doesn’t mean it will bounce right away.
You rode it down from $2,500 to $1,800. Has your account been cut in half? ETFs have seen $760 million in outflows, the upgrade is delayed, but RSI has already fallen to 25—is this a golden buying opportunity or a bottomless pit?
Back in October, ETH was still at $2,500, and you thought, “If I just hold on a little longer, I’ll break even.”
Now it’s at $1,800. Your account is down nearly 30%. The first thing you do every day when you open the app is check whether it has bounced, then quietly close it.
What stings even more is that every news story you see tells you the same thing: ETFs are seeing outflows, institutions are pulling back, and ETH is finished.
First: ETFs are seeing outflows, but what’s fleeing isn’t “faith”—it’s “interest rates”
U.S. spot ETH ETFs saw $399 million in net outflows last week, with November’s total topping $760 million. BlackRock’s ETHA accounted for most of the outflows.
Sounds scary?
But look closer—cumulative net inflows are still at $14 billion. Institutions aren’t liquidating everything and leaving; they’re reducing their positions to hedge risk.
Why hedge?
The 10-year U.S. Treasury yield is 5.15%, while staking ETH earns you only 2.4% to 2.6% a year.
For the same kind of “easy money,” Treasuries are twice as attractive as ETH staking.
It’s not that ETH has lost its appeal; Treasuries are just that attractive. Capital hasn’t betrayed you—it’s turned away from the yield.
Second: The upgrade delay isn’t bearish—it’s about “expectations being priced in too far”
The Glamsterdam upgrade is expected in late 2026 or early 2027, but EIP-8037/8038 could affect up to 15,000 contracts. Developers are still debating, and there’s a risk of further delays.
Does hearing “delay” make you panic? Did ETH go up when the Pectra upgrade went live?
No. The good news was already priced in, and the price fell instead.
An upgrade going live can be a “sell the news” moment; a delay can be a buying opportunity as expectations are repriced. The market had already priced in an “upgrade by year-end.” Now that it’s delayed, the excess froth is being squeezed out.
Third: The technicals are deeply oversold, but “oversold” doesn’t mean “bottomed out”
The daily RSI is at 25 to 28—deeply oversold. Historically, this is often where a bounce begins.
But the price is well below the 20/50/100/200 EMAs. The 20 EMA is at 2,040 to 2,050, while the longer-term moving averages are above 2,200. The moving averages are in a bearish alignment; the trend hasn’t changed.
Support: 1,750 to 1,760 (24-hour low), 1,710 to 1,720 (structural support), then 1,600 to 1,650
Resistance: 1,830 to 1,850 (intraday high + short-term moving averages), 1,900 to 2,000 (psychological level + former support turned resistance), then 2,100 to 2,200
An oversold RSI is like a spring compressed all the way down—but that doesn’t mean it will bounce right away.