$BTC BTCUSDT perp - 64.202, minus 0,59 percent
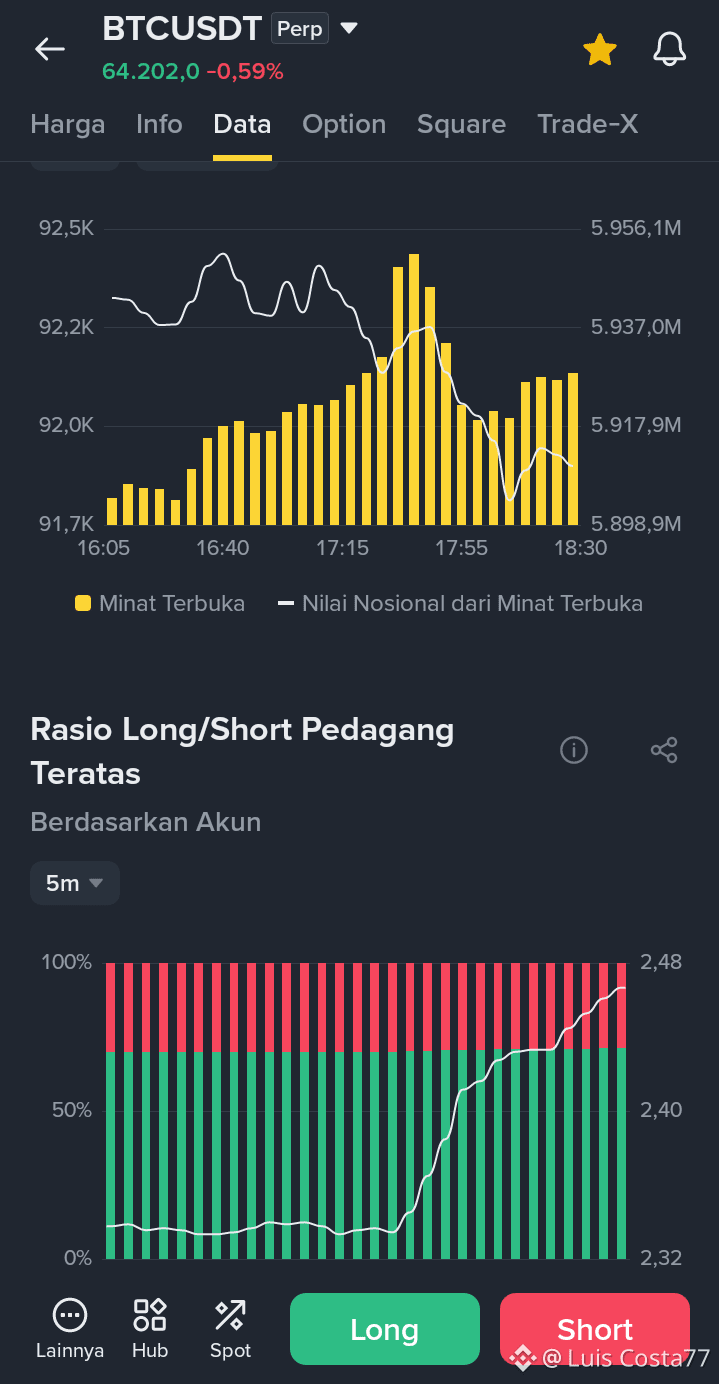
This is Open Interest and whale positioning data, not a regular price chart.
*Open Interest (top)*
The yellow bars rose from 5.898M to 5.956M around 17:30, then fell to 5.917M, then rose again to around 5.93M at 18:30.
This means a lot of new positions were opened, rather than old positions being closed. The market is active, not quiet.
But the white line (Notional Value) actually fell from 92,2K to 91,8K. This means the price fell, but Open Interest rose. This pattern usually appears when people add Short positions, or add Long positions to support the falling price.
*Top Trader Long/Short Ratio - By Account (bottom)*
Green (Long) is around 70 percent, and red (Short) is around 30 percent. The white ratio line rose from 2,32 to 2,48 at the end.
This means whales / top traders are leaning more toward Long, and they’re adding to their Long positions just as the price falls to 64.202.
This is somewhat contradictory. The price is falling, OI is rising, and whales are adding Longs. There are two ways to interpret this:
1. Whales believe this is just a correction and expect a bounce
2. Whales are providing liquidity for those going Short, and are ready to get trapped if the price continues falling
Don’t blindly go Long just because whales are Long. Wait for the price to move back above 64.596 and hold there. If 63.300 breaks, these crowded Long positions could get liquidated and accelerate the drop.
This is Open Interest and whale positioning data, not a regular price chart.
*Open Interest (top)*
The yellow bars rose from 5.898M to 5.956M around 17:30, then fell to 5.917M, then rose again to around 5.93M at 18:30.
This means a lot of new positions were opened, rather than old positions being closed. The market is active, not quiet.
But the white line (Notional Value) actually fell from 92,2K to 91,8K. This means the price fell, but Open Interest rose. This pattern usually appears when people add Short positions, or add Long positions to support the falling price.
*Top Trader Long/Short Ratio - By Account (bottom)*
Green (Long) is around 70 percent, and red (Short) is around 30 percent. The white ratio line rose from 2,32 to 2,48 at the end.
This means whales / top traders are leaning more toward Long, and they’re adding to their Long positions just as the price falls to 64.202.
This is somewhat contradictory. The price is falling, OI is rising, and whales are adding Longs. There are two ways to interpret this:
1. Whales believe this is just a correction and expect a bounce
2. Whales are providing liquidity for those going Short, and are ready to get trapped if the price continues falling
Don’t blindly go Long just because whales are Long. Wait for the price to move back above 64.596 and hold there. If 63.300 breaks, these crowded Long positions could get liquidated and accelerate the drop.