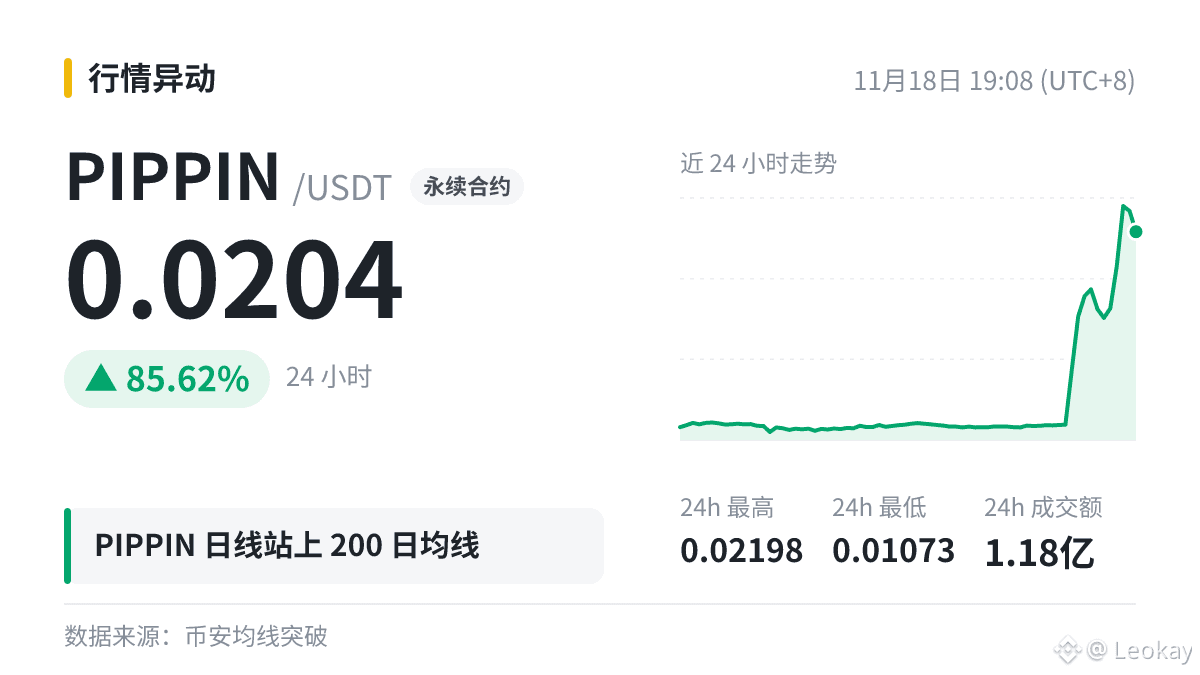
$PIPPIN |Daily close above MA200|MA200 0.01796
Before looking at position size, first understand moving averages.
On a daily chart, MA200 is the average closing price over the most recent 200 days and is often viewed as a reference line for bull and bear trends; MA50 is commonly used to gauge the medium-term direction.
In sideways markets, prices often move back and forth across moving averages, so signals that the price has moved above or below them can easily be false; moving averages are more useful in trending markets.
Learning to read indicators isn’t difficult. The hard part is still following the rules when the market is at its most extreme.
Before looking at position size, first understand moving averages.
On a daily chart, MA200 is the average closing price over the most recent 200 days and is often viewed as a reference line for bull and bear trends; MA50 is commonly used to gauge the medium-term direction.
In sideways markets, prices often move back and forth across moving averages, so signals that the price has moved above or below them can easily be false; moving averages are more useful in trending markets.
Learning to read indicators isn’t difficult. The hard part is still following the rules when the market is at its most extreme.