🔴 $BTC — looking to short, but in no hurry
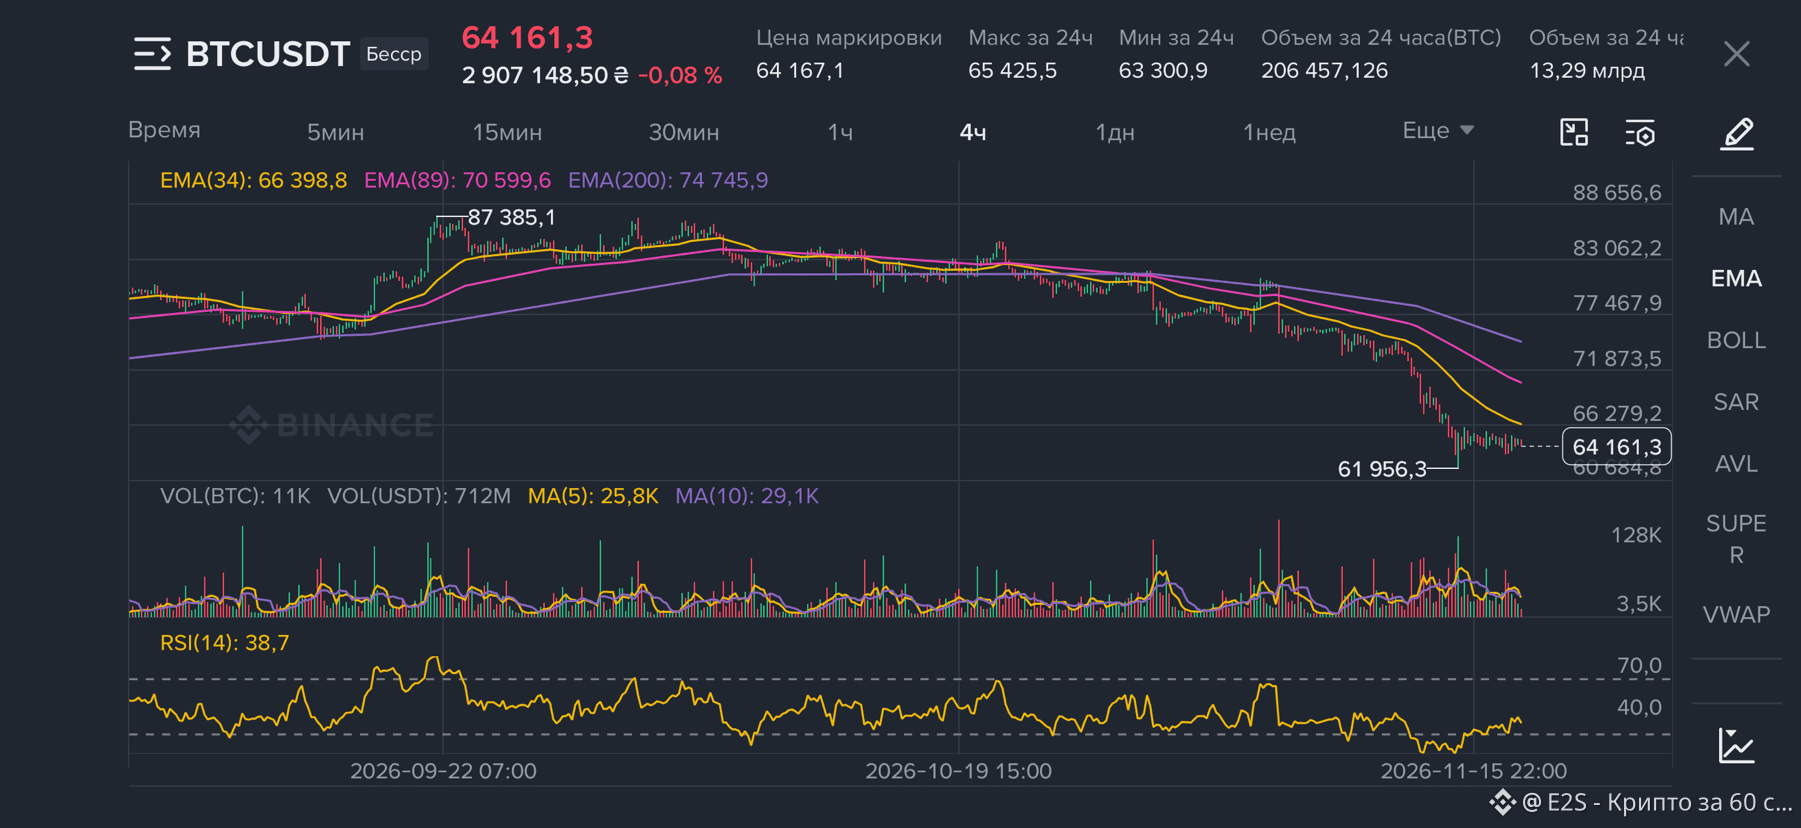
Opened the chart, and the picture isn’t encouraging for the bulls so far. We plunged from 87 385 to 61 956, and now we’ve been stuck in a narrow range of 63 300–65 400 for several days. Many are waiting for a reversal, but I just see a pause.
What concerns me:
— on the 4h chart, price is below all three EMAs (34 / 89 / 200 = 66 400 / 70 600 / 74 746), and they’re pointing down;
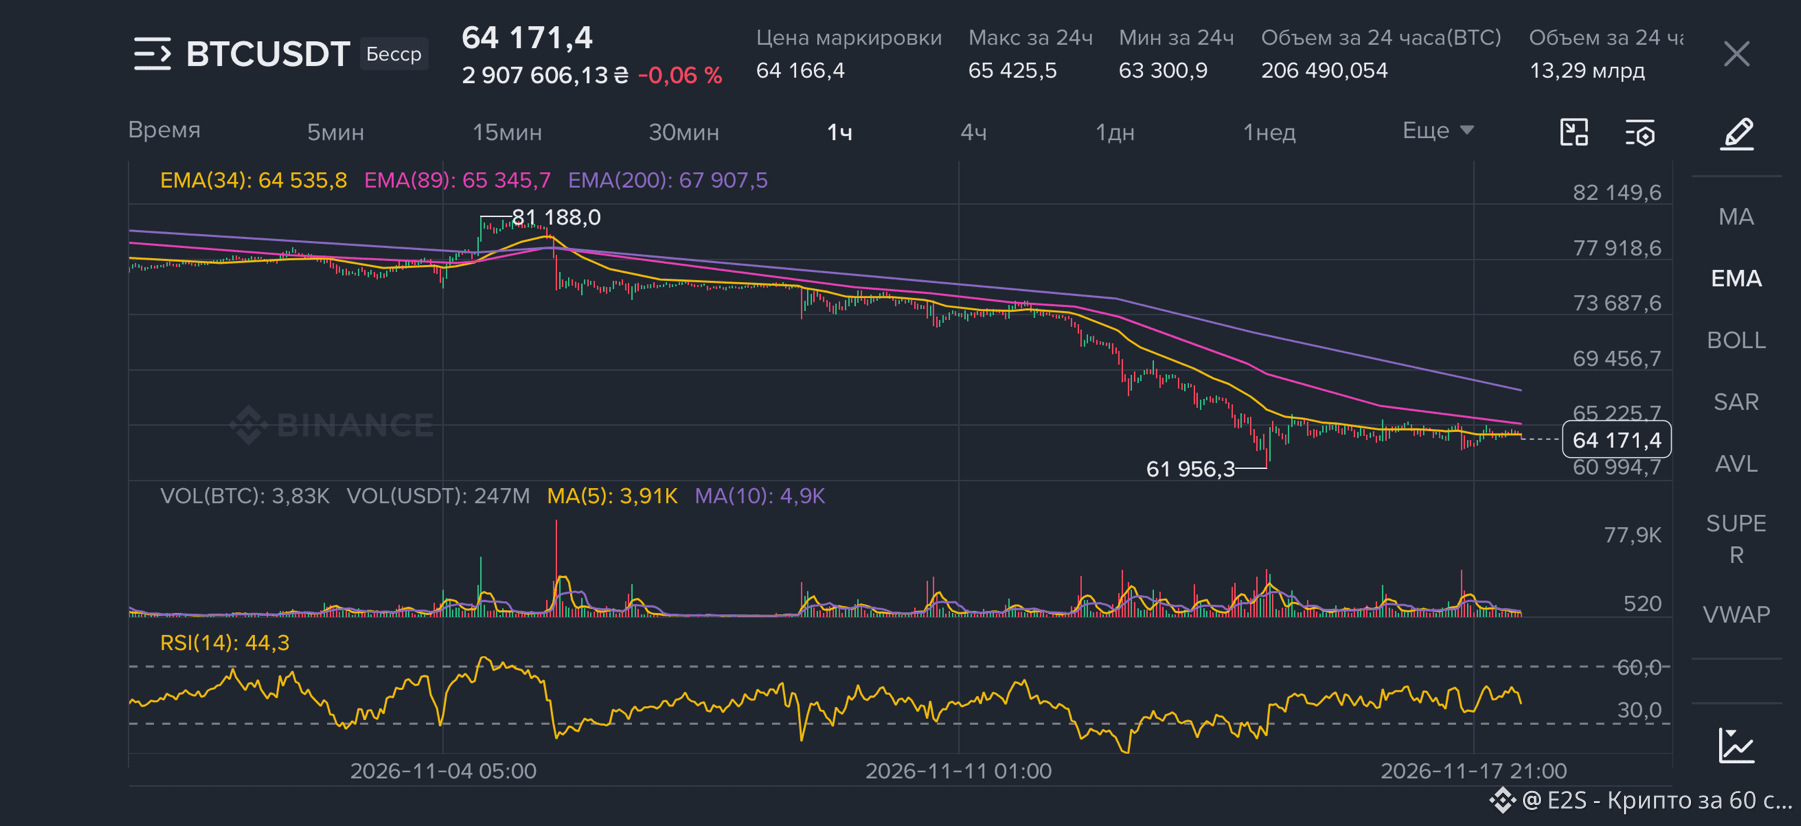
— on the 1h chart, EMA34 (64 536) is acting as a ceiling, pushing price down time after time;
— 4h RSI is only 38,7: it’s not oversold yet, so there’s room to fall;
— volume is fading in this sideways range: buyers aren’t coming in, but simply nobody is selling.
My plan: I’m waiting for a bounce to 65 250–65 400. That’s where the 1h EMA89 and the daily high are—a strong zone. I’ll look to short from there.
🎯 TP1: 64 300 (−1,6%)
🎯 TP2: 63 350 (−3,0%)
🎯 TP3: 62 000 (−5,1%)
🛑 SL: 66 450 (+1,7%)
I’ll take profits in stages: half at the first target, the rest as it plays out; after TP1, move the stop to breakeven. If we don’t reach the zone, I won’t chase it—the trade simply won’t happen.
What would change my mind: if BTC holds above 66 400 on the 4h chart. Then I’ll cancel the short and look toward 67 900 instead.
⚠️ This is my personal view of the market, not financial advice.
$BTC
Opened the chart, and the picture isn’t encouraging for the bulls so far. We plunged from 87 385 to 61 956, and now we’ve been stuck in a narrow range of 63 300–65 400 for several days. Many are waiting for a reversal, but I just see a pause.
What concerns me:
— on the 4h chart, price is below all three EMAs (34 / 89 / 200 = 66 400 / 70 600 / 74 746), and they’re pointing down;
— on the 1h chart, EMA34 (64 536) is acting as a ceiling, pushing price down time after time;
— 4h RSI is only 38,7: it’s not oversold yet, so there’s room to fall;
— volume is fading in this sideways range: buyers aren’t coming in, but simply nobody is selling.
My plan: I’m waiting for a bounce to 65 250–65 400. That’s where the 1h EMA89 and the daily high are—a strong zone. I’ll look to short from there.
🎯 TP1: 64 300 (−1,6%)
🎯 TP2: 63 350 (−3,0%)
🎯 TP3: 62 000 (−5,1%)
🛑 SL: 66 450 (+1,7%)
I’ll take profits in stages: half at the first target, the rest as it plays out; after TP1, move the stop to breakeven. If we don’t reach the zone, I won’t chase it—the trade simply won’t happen.
What would change my mind: if BTC holds above 66 400 on the 4h chart. Then I’ll cancel the short and look toward 67 900 instead.
⚠️ This is my personal view of the market, not financial advice.
$BTC