#cryptotradingpro #BTC
$BTC Market Overview: A Pause After a Cascading Drop. What’s Next? 📉📊
Following an aggressive decline from $76,000 to a local low around $62,500, Bitcoin has entered a consolidation phase. Let’s analyze the current chart situation and key liquidity levels:
🔍 What do the charts show?
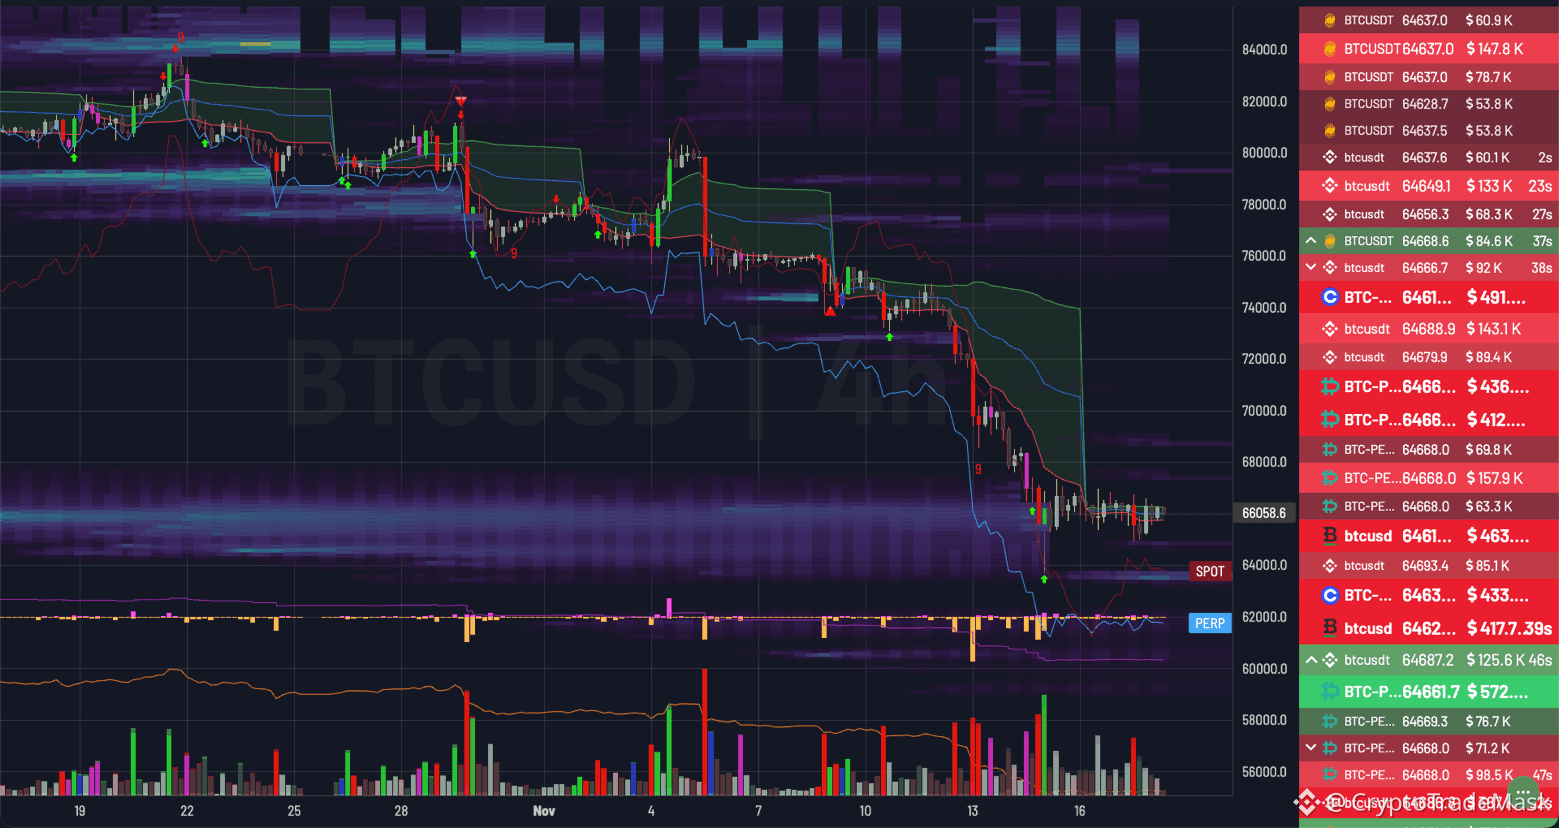
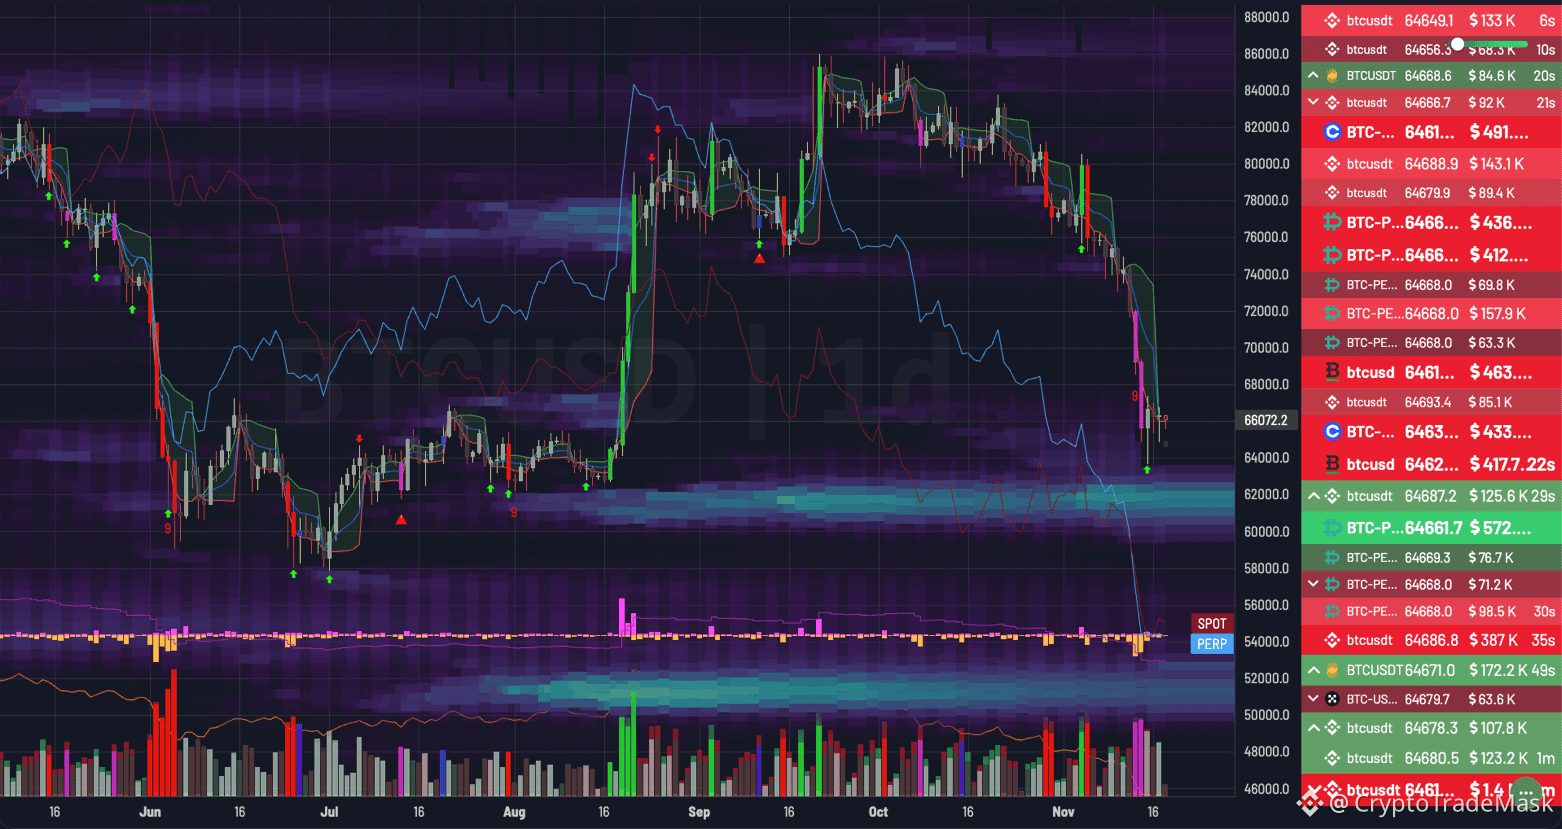
➡️ Higher Timeframes (1D / 4H): The structure remains bearish. The price has broken through the previous accumulation zone ($80k–$86k) and settled back into the summer trading range. On the heatmap, dense limit sell walls have formed above, specifically at the $67,500–$68,000 and $70,000+ levels.
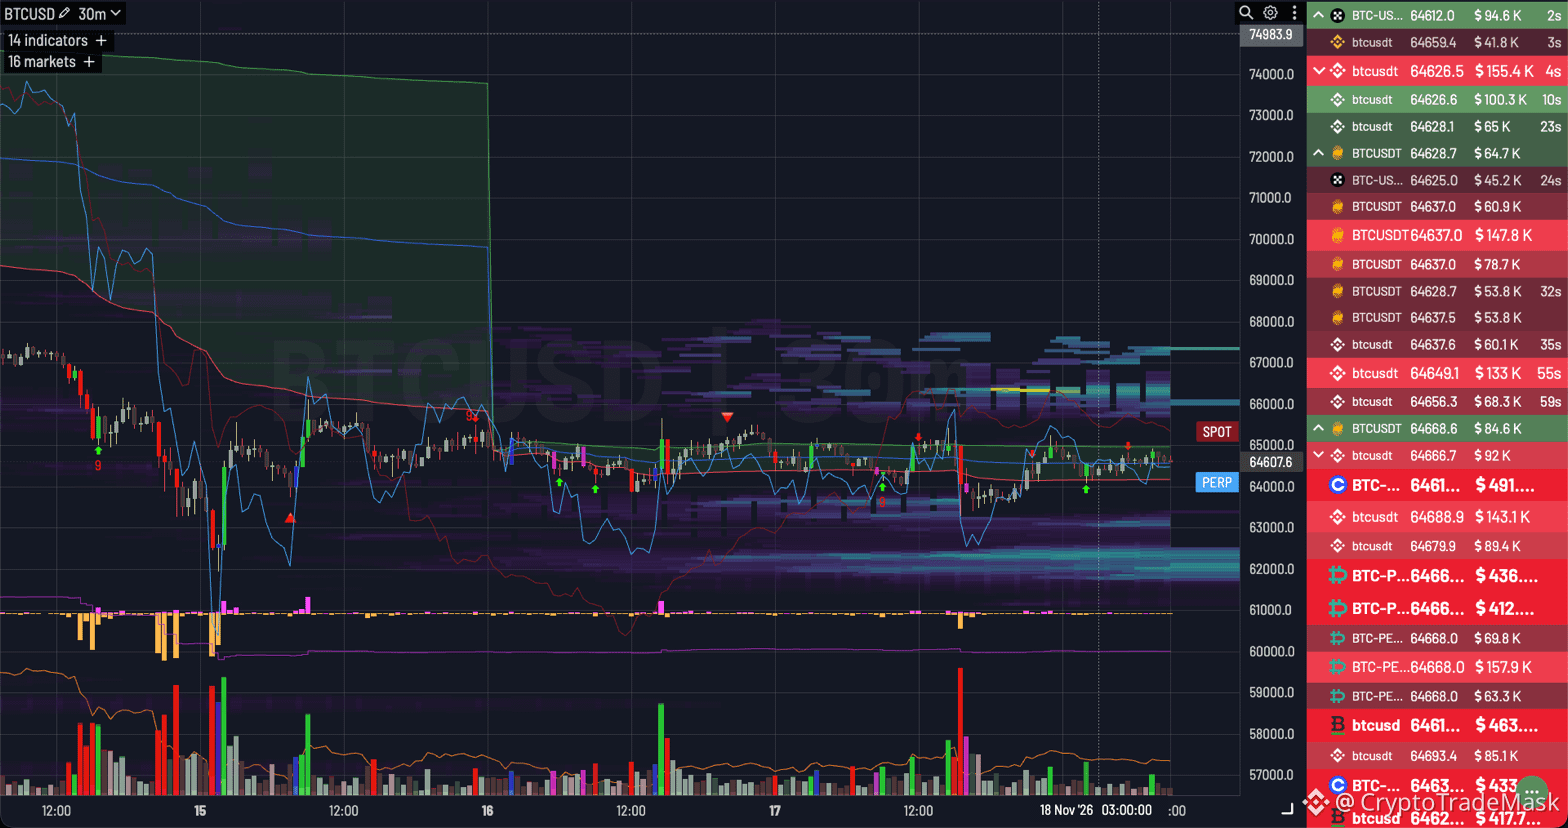
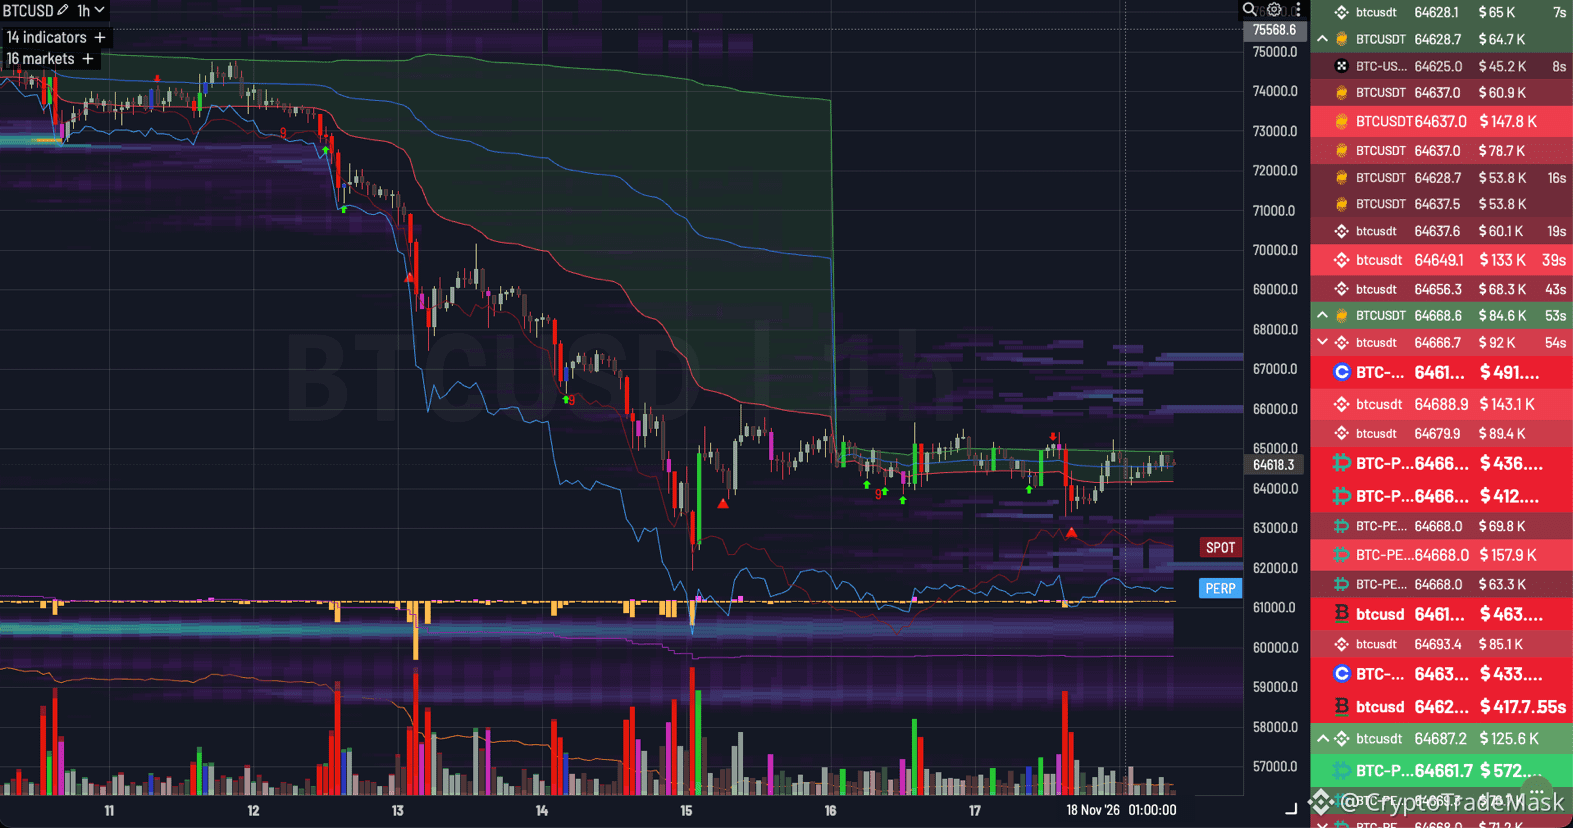
➡️ Lower Timeframes (1H / 30M): A local sideways range between $63,500 and $65,600 (current price: ~$64,600). Large market sell orders are currently being absorbed by limit buy orders at the lower boundary of the range.
🎯 Key Levels:
➡️ Resistance: $65,500–$65,800 (local) | $67,500–$68,000 (major)
➡️ Support: $63,500–$64,000 (local) | $60,000–$62,000 (global demand zone and a large cluster of bids)
📊 Two main scenarios:
1️⃣ Base case (🔴continued decline): The current sideways movement looks like a pause before a new downward impulse. If the price fails to break above and consolidate over $65,800, there is a high probability of a retest of $63,500, followed by a move toward the $60,000–$62,000 zone to sweep liquidity.
2️⃣ Alternative case (🟢corrective rebound): A firm close of a 1H candle above $65,800 would open the way to sweep short-side liquidity in the $67,500–$68,500 range. However, until the price returns above $70,000, any upward movement remains merely a rebound within a downtrend.
$BTC Market Overview: A Pause After a Cascading Drop. What’s Next? 📉📊
Following an aggressive decline from $76,000 to a local low around $62,500, Bitcoin has entered a consolidation phase. Let’s analyze the current chart situation and key liquidity levels:
🔍 What do the charts show?
➡️ Higher Timeframes (1D / 4H): The structure remains bearish. The price has broken through the previous accumulation zone ($80k–$86k) and settled back into the summer trading range. On the heatmap, dense limit sell walls have formed above, specifically at the $67,500–$68,000 and $70,000+ levels.
➡️ Lower Timeframes (1H / 30M): A local sideways range between $63,500 and $65,600 (current price: ~$64,600). Large market sell orders are currently being absorbed by limit buy orders at the lower boundary of the range.
🎯 Key Levels:
➡️ Resistance: $65,500–$65,800 (local) | $67,500–$68,000 (major)
➡️ Support: $63,500–$64,000 (local) | $60,000–$62,000 (global demand zone and a large cluster of bids)
📊 Two main scenarios:
1️⃣ Base case (🔴continued decline): The current sideways movement looks like a pause before a new downward impulse. If the price fails to break above and consolidate over $65,800, there is a high probability of a retest of $63,500, followed by a move toward the $60,000–$62,000 zone to sweep liquidity.
2️⃣ Alternative case (🟢corrective rebound): A firm close of a 1H candle above $65,800 would open the way to sweep short-side liquidity in the $67,500–$68,500 range. However, until the price returns above $70,000, any upward movement remains merely a rebound within a downtrend.