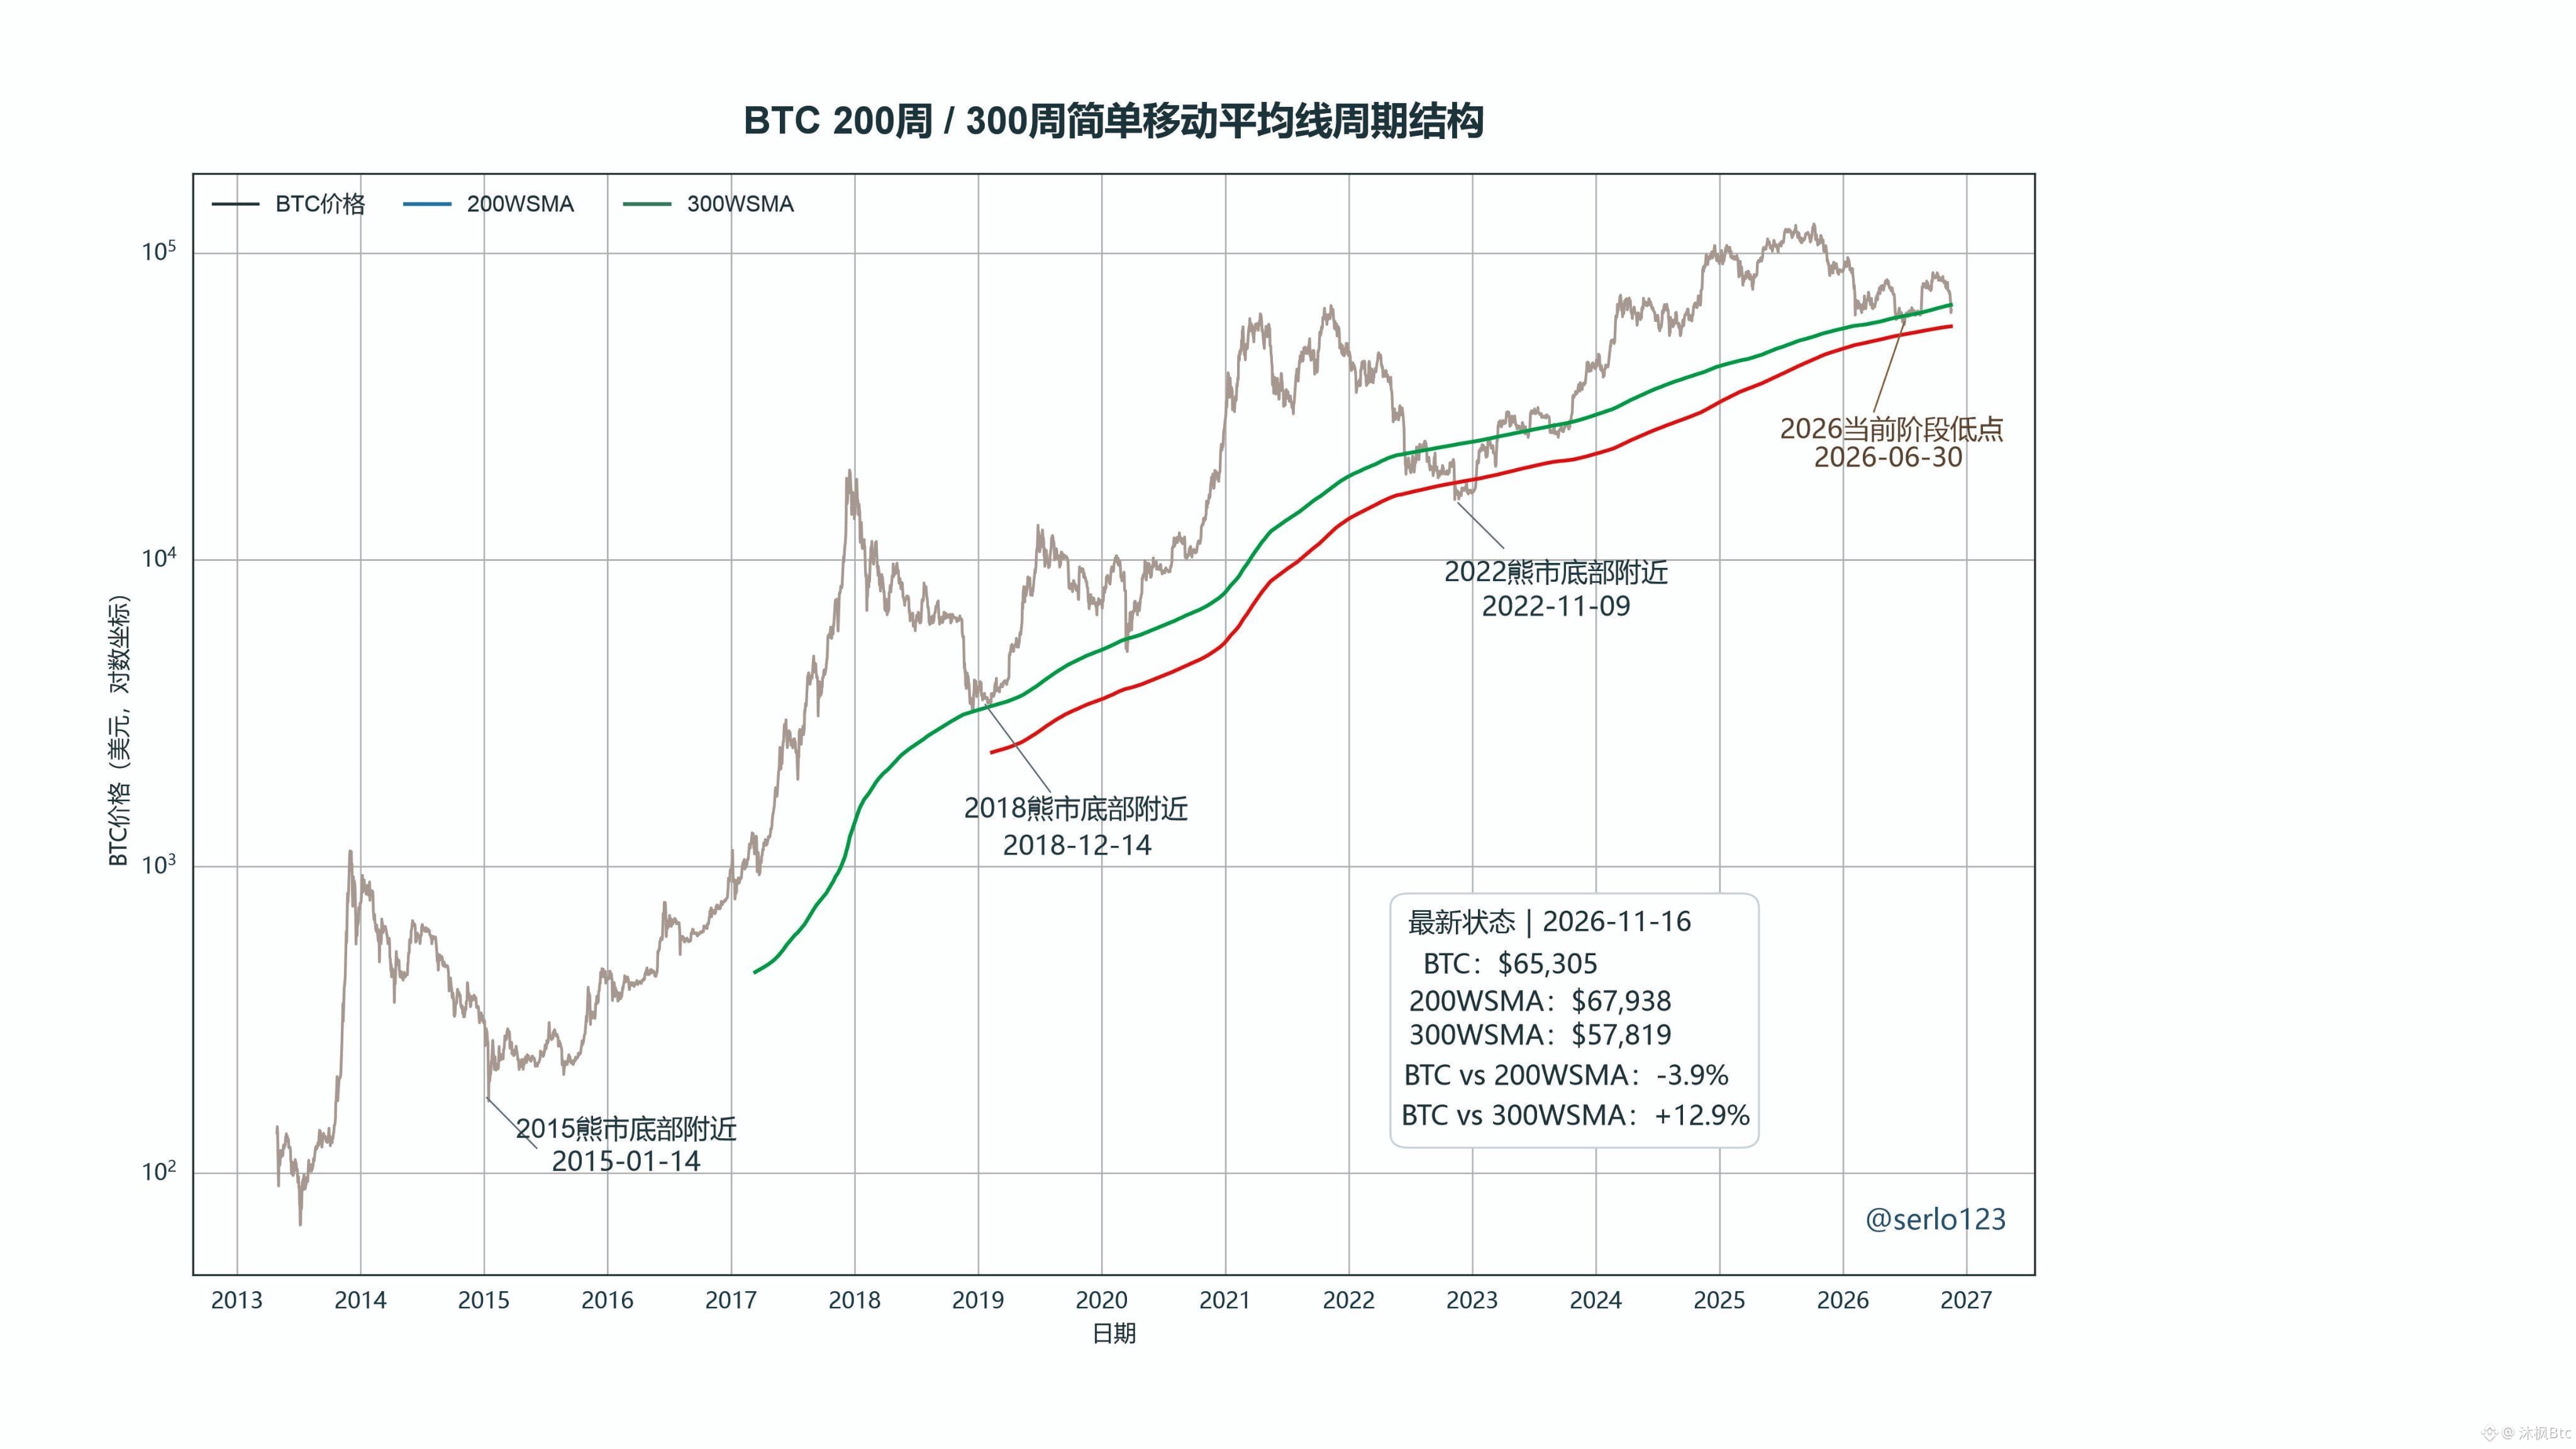
With the market looking weak, I’m bringing out the bottom-fishing indicators again: the 200-week simple moving average (200WSMA) and the 300-week simple moving average (300WSMA).
(1) Historically, the zone between the two moving averages has often offered relatively good value for BTC.
(2) Normal bear-market bottoms tend to form near the 200WSMA.
(3) In 2022, compounded by the FTX collapse, the price plunged well below the 200WSMA and approached the 300WSMA.
(4) In this cycle, in 2026: BTC hit a temporary low around the end of June and has recently fallen below the 200WSMA again.
If this long-term structure still broadly holds, and we’re about 511 days away from the next halving (expected in mid-April 2028), the bottom price zone is relatively clear.
Current BTC price: $65,305; 200WSMA: about $67,938 (BTC is about 4% below the average); 300WSMA: about $57,819 (BTC is about 13% above the average).
(1) Historically, the zone between the two moving averages has often offered relatively good value for BTC.
(2) Normal bear-market bottoms tend to form near the 200WSMA.
(3) In 2022, compounded by the FTX collapse, the price plunged well below the 200WSMA and approached the 300WSMA.
(4) In this cycle, in 2026: BTC hit a temporary low around the end of June and has recently fallen below the 200WSMA again.
If this long-term structure still broadly holds, and we’re about 511 days away from the next halving (expected in mid-April 2028), the bottom price zone is relatively clear.
Current BTC price: $65,305; 200WSMA: about $67,938 (BTC is about 4% below the average); 300WSMA: about $57,819 (BTC is about 13% above the average).