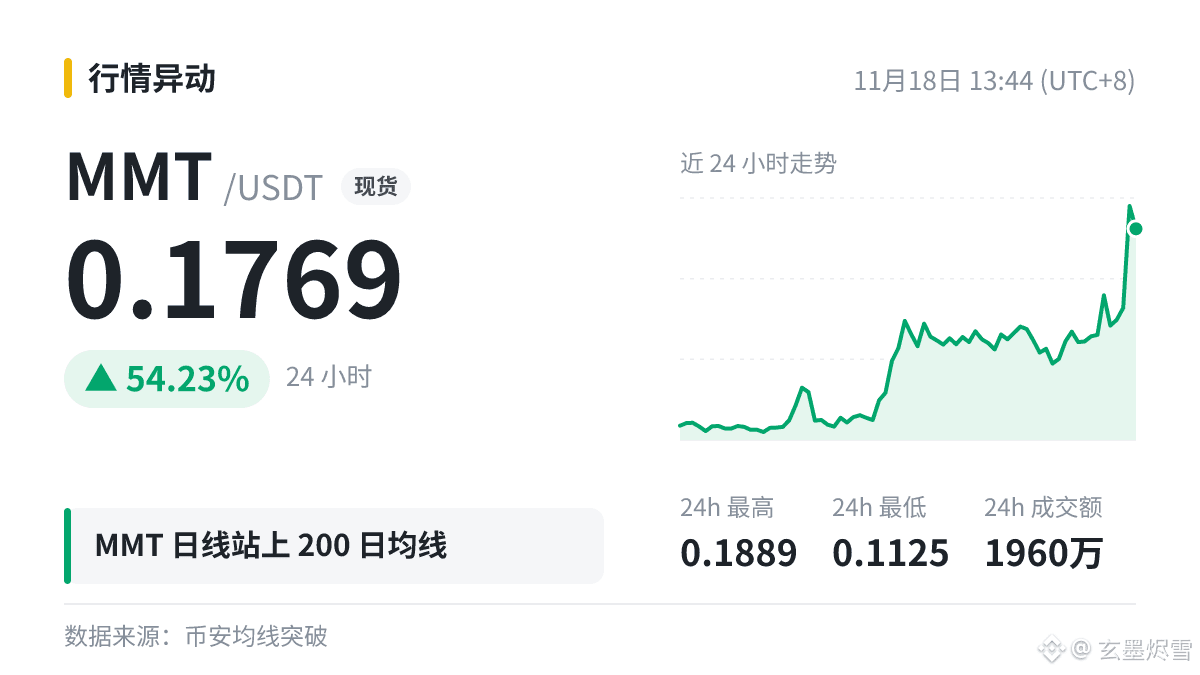
$MMT The daily chart has moved above the MA200 (0.1538), with the current price at 0.1769.
The daily MA200 is often considered the dividing line between bull and bear markets. After moving above it, the key is whether a pullback finds support near the moving average. If it holds, the structure improves.
Is this an opportunity or just noise?
The daily MA200 is often considered the dividing line between bull and bear markets. After moving above it, the key is whether a pullback finds support near the moving average. If it holds, the structure improves.
Is this an opportunity or just noise?