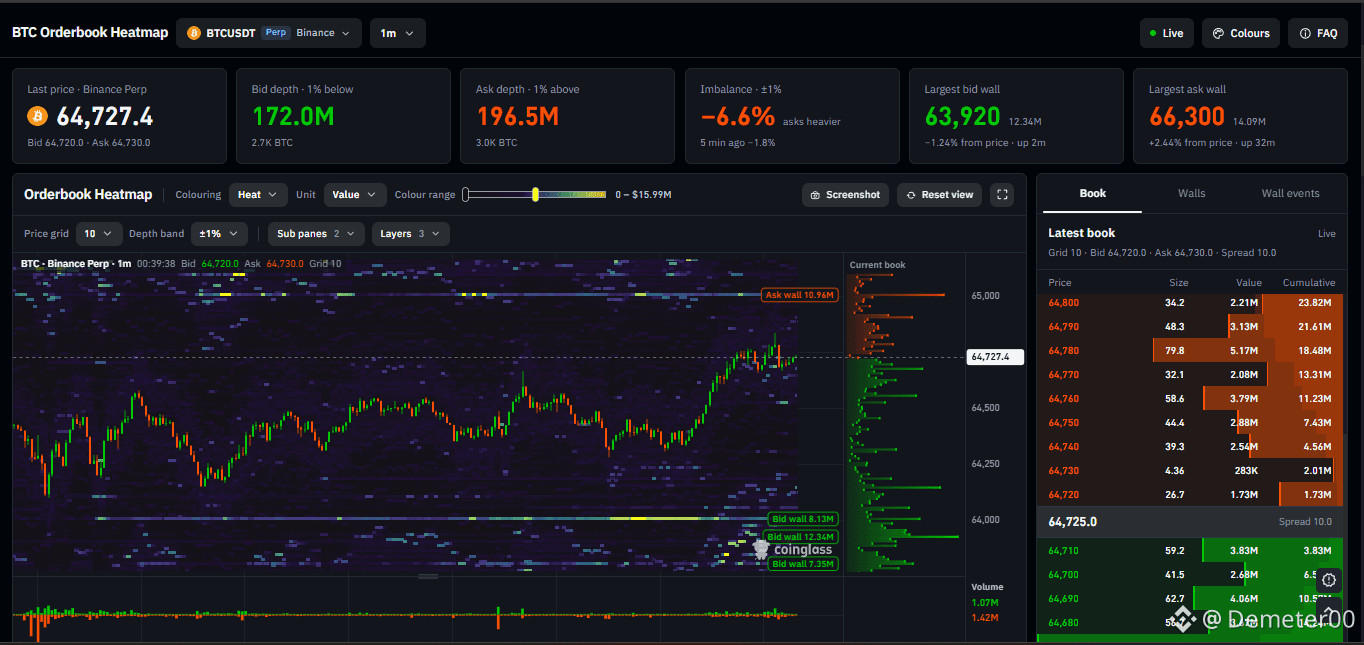
Something I really liked about this CoinGlass chart is how much information it lets you observe in real time—not just for BTC, but for other cryptocurrencies as well.
You can view market liquidity, large buy and sell walls, areas where capital is concentrated, and levels with significant orders waiting to be executed. It’s interesting to watch these walls appear and disappear, see liquidity concentrations shift, and observe how the price can approach these areas.
It’s a very useful tool for tracking the movements of major market participants, identifying potential liquidity zones, and understanding where the price might encounter resistance or support.
What I like most is that you can see much more than just candlesticks: you can see where liquidity is placed, which side has greater depth, and how the order book changes in real time.
That said, a wall can be removed before it’s executed, so that doesn’t necessarily mean the price will reach it. But having all this information on a single screen is a huge advantage when analyzing any cryptocurrency.
#OrderBook #OrderFlow #SmartMoney #CryptoAnalysis $BTC
You can view market liquidity, large buy and sell walls, areas where capital is concentrated, and levels with significant orders waiting to be executed. It’s interesting to watch these walls appear and disappear, see liquidity concentrations shift, and observe how the price can approach these areas.
It’s a very useful tool for tracking the movements of major market participants, identifying potential liquidity zones, and understanding where the price might encounter resistance or support.
What I like most is that you can see much more than just candlesticks: you can see where liquidity is placed, which side has greater depth, and how the order book changes in real time.
That said, a wall can be removed before it’s executed, so that doesn’t necessarily mean the price will reach it. But having all this information on a single screen is a huge advantage when analyzing any cryptocurrency.
#OrderBook #OrderFlow #SmartMoney #CryptoAnalysis $BTC