$BTC BTC Market Notes: Current price 64,600. After reaching 63,500 overnight, price moved up to 65,000 before pulling back. How to trade this afternoon?
2-hour chart: After bottoming at 61,956, price staged a corrective rebound and briefly moved above EMA15, now at 64,195. However, EMA30 at 64,825 is acting as resistance overhead, while the medium- and long-term moving averages remain above price at 66,170–68,872. The medium-term downtrend is still intact. MACD has formed a bullish crossover below the zero line, suggesting there is room for the rebound to continue, but its strength is limited. The Bollinger Band range is 63,760–65,445, with the current price stuck below the middle band.
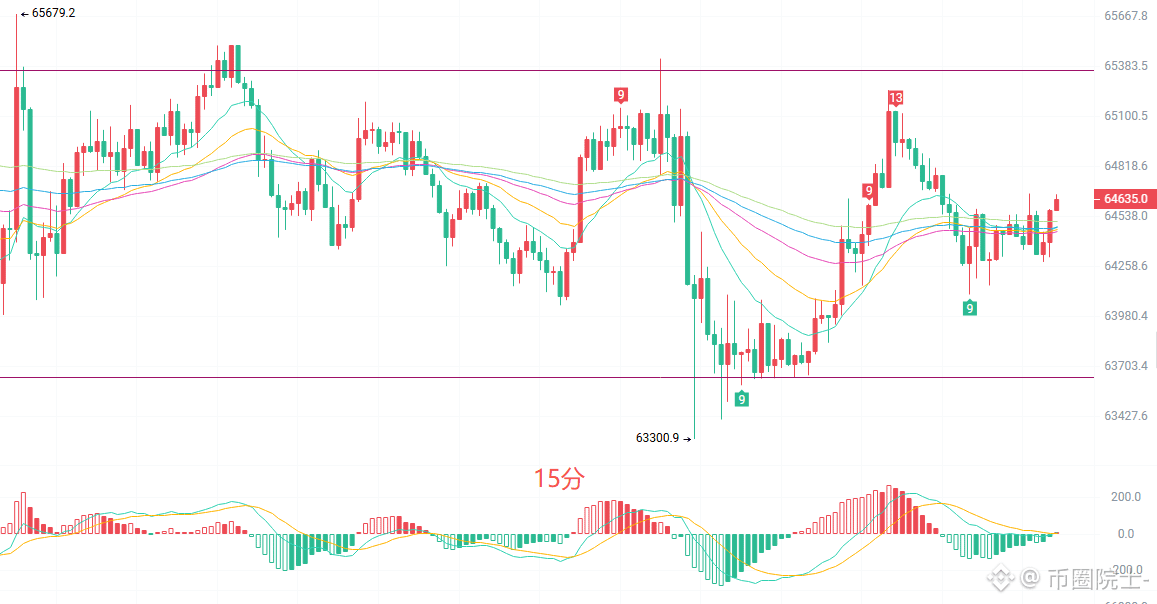
15-minute chart: Price is moving sideways within a 63,300–65,680 range. It has fallen back below the moving-average cluster at 64,439–64,507. MACD has turned negative, and the rebound is losing steam, suggesting weak consolidation in the short term.
Key levels to watch: Afternoon setup
Bullish: If price stabilizes at 64,150–64,200, look for a move higher. Stop-loss below 63,750; targets 64,750–65,100.
Bearish: If price is rejected at 64,750–64,830, look for a move lower. Stop-loss above 65,150; targets 64,200–63,760.
In a ranging market, key levels matter more than direction. This is for technical analysis purposes only and does not constitute investment advice. Trade at your own risk.
#BTC走势分析
2-hour chart: After bottoming at 61,956, price staged a corrective rebound and briefly moved above EMA15, now at 64,195. However, EMA30 at 64,825 is acting as resistance overhead, while the medium- and long-term moving averages remain above price at 66,170–68,872. The medium-term downtrend is still intact. MACD has formed a bullish crossover below the zero line, suggesting there is room for the rebound to continue, but its strength is limited. The Bollinger Band range is 63,760–65,445, with the current price stuck below the middle band.
15-minute chart: Price is moving sideways within a 63,300–65,680 range. It has fallen back below the moving-average cluster at 64,439–64,507. MACD has turned negative, and the rebound is losing steam, suggesting weak consolidation in the short term.
Key levels to watch: Afternoon setup
Bullish: If price stabilizes at 64,150–64,200, look for a move higher. Stop-loss below 63,750; targets 64,750–65,100.
Bearish: If price is rejected at 64,750–64,830, look for a move lower. Stop-loss above 65,150; targets 64,200–63,760.
In a ranging market, key levels matter more than direction. This is for technical analysis purposes only and does not constitute investment advice. Trade at your own risk.
#BTC走势分析