
$NEAR 𝗨𝗣 𝟰.𝟲% 𝗪𝗛𝗜𝗟𝗘 𝗧𝗛𝗘 𝗠𝗔𝗥𝗞𝗘𝗧 𝗕𝗟𝗘𝗘𝗗𝗦. 𝗧𝗛𝗘 𝗖𝗛𝗔𝗥𝗧 𝗘𝗫𝗣𝗟𝗔𝗜𝗡𝗦 𝗪𝗛𝗬.
NEAR was one of this morning's top performers among large caps. My TradingView read:
𝗧𝗵𝗲 𝘀𝘁𝗿𝘂𝗰𝘁𝘂𝗿𝗲
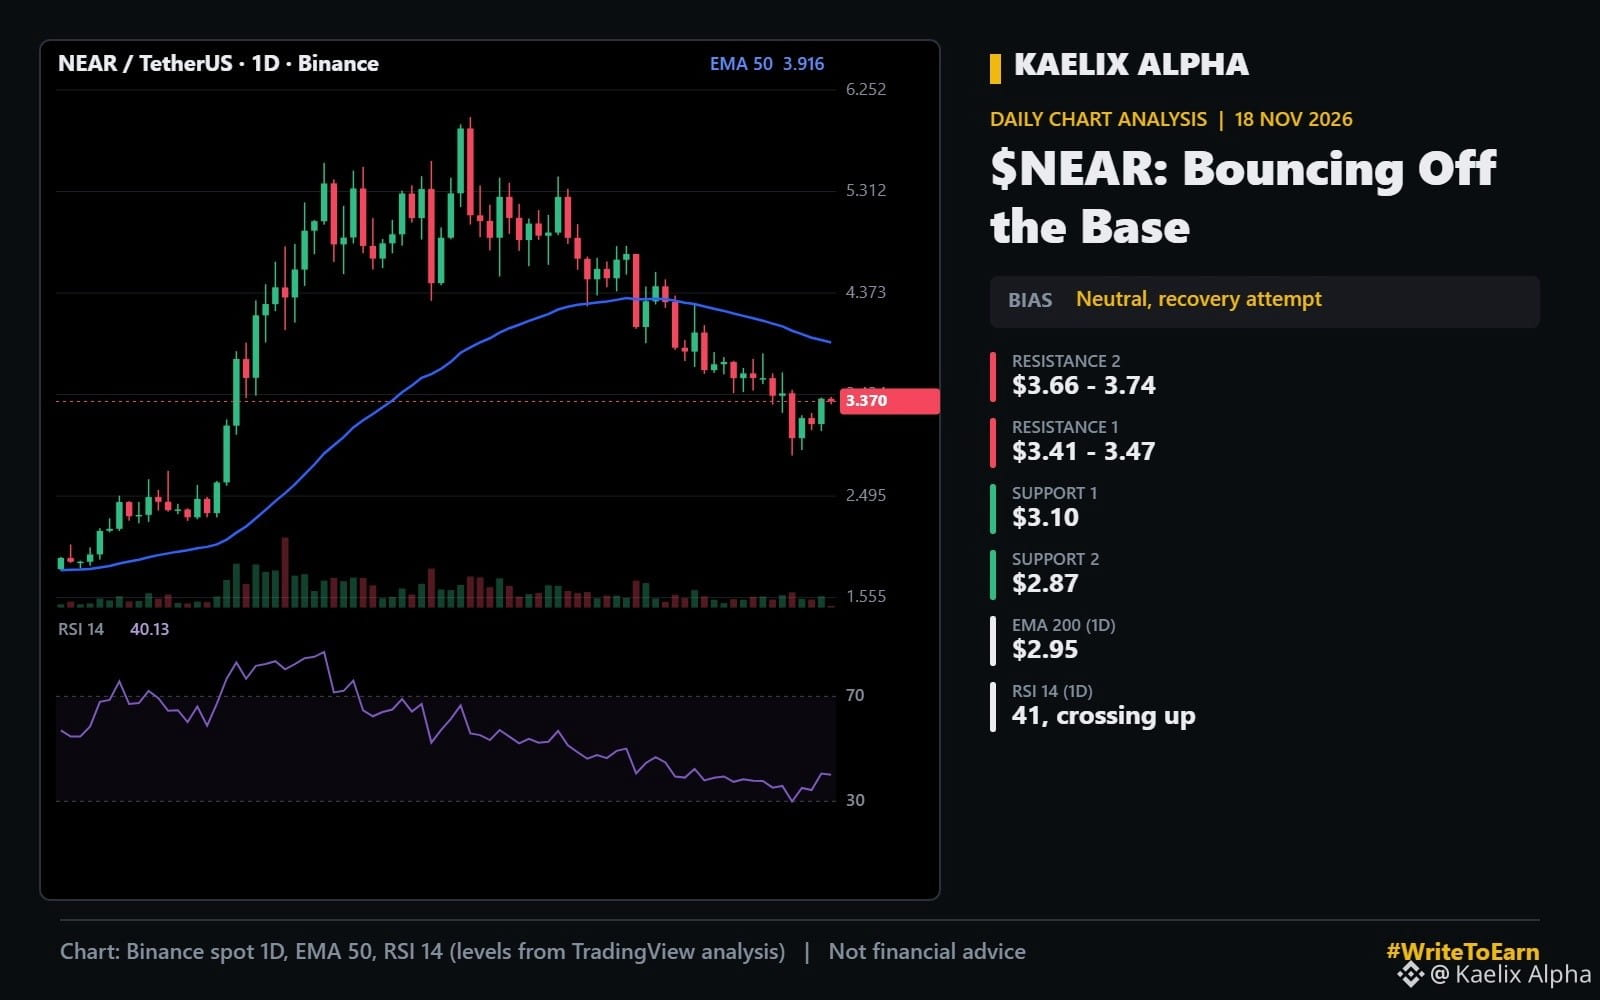
NEAR had a huge run from about $2 to $6 between September and early October. It has since corrected 50%, but the low at $2.87 held right above the 200-day EMA (about $2.95). That is a textbook higher-timeframe retest.
𝗧𝗵𝗲 𝗺𝗼𝗺𝗲𝗻𝘁𝘂𝗺
Daily RSI is 41 and just crossed above its moving average. On the 4 hour chart RSI is 58. Buyers are clearly active.
𝗞𝗲𝘆 𝗹𝗲𝘃𝗲𝗹𝘀
Resistance: $3.41 to $3.47, then $3.66 to $3.74 (20-day EMA zone)
Support: $3.10, then $2.87
Trend line: 50-day EMA near $3.92
𝗠𝘆 𝗿𝗲𝗮𝗱
A daily close above $3.47 opens room to the 20-day EMA. As long as $2.87 holds, the bigger uptrend from September is still intact.
Is NEAR the strongest alt on your watchlist?
#WriteToEarn #Write2Earn #NEAR #NEARProtocol #TechnicalAnalysis
Not financial advice. Do your own research.
NEAR was one of this morning's top performers among large caps. My TradingView read:
𝗧𝗵𝗲 𝘀𝘁𝗿𝘂𝗰𝘁𝘂𝗿𝗲
NEAR had a huge run from about $2 to $6 between September and early October. It has since corrected 50%, but the low at $2.87 held right above the 200-day EMA (about $2.95). That is a textbook higher-timeframe retest.
𝗧𝗵𝗲 𝗺𝗼𝗺𝗲𝗻𝘁𝘂𝗺
Daily RSI is 41 and just crossed above its moving average. On the 4 hour chart RSI is 58. Buyers are clearly active.
𝗞𝗲𝘆 𝗹𝗲𝘃𝗲𝗹𝘀
Resistance: $3.41 to $3.47, then $3.66 to $3.74 (20-day EMA zone)
Support: $3.10, then $2.87
Trend line: 50-day EMA near $3.92
𝗠𝘆 𝗿𝗲𝗮𝗱
A daily close above $3.47 opens room to the 20-day EMA. As long as $2.87 holds, the bigger uptrend from September is still intact.
Is NEAR the strongest alt on your watchlist?
#WriteToEarn #Write2Earn #NEAR #NEARProtocol #TechnicalAnalysis
Not financial advice. Do your own research.