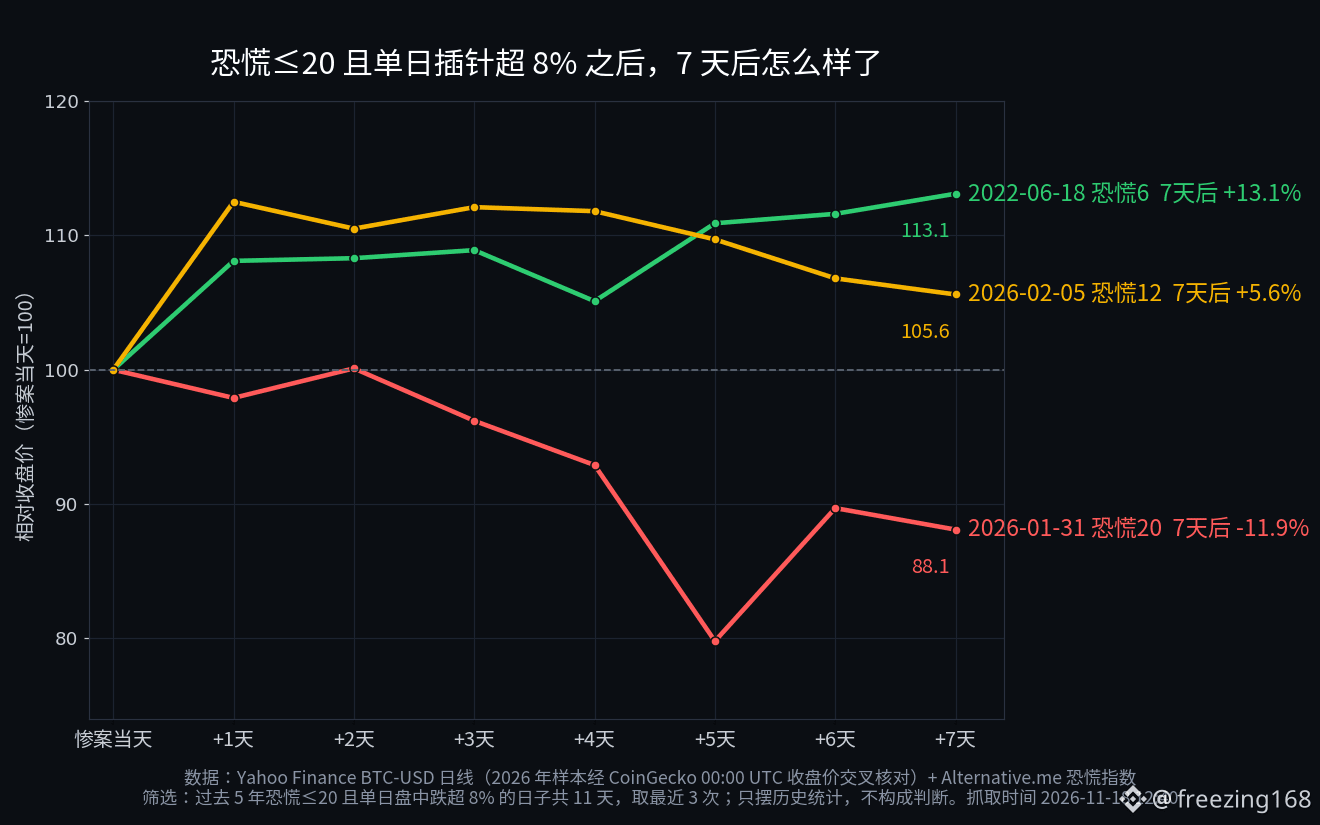
Over the past 5 years, there have been only 11 days when the Fear Index was ≤20 and BTC fell more than 8% intraday. Of the most recent 3 cases, two were up and one was down 7 days later—there’s simply no clear conclusion.
Here are the 7-day outcomes for the 3 most recent cases:
2022-06-18: Fear Index 6, intraday drop of 13.5%, up 13.1% after 7 days;
2026-01-31: Fear Index 20, intraday drop of 9.9%, down 11.9% after 7 days;
2026-02-05: Fear Index 12, intraday drop of 14.6%, up 5.6% after 7 days.
The sample is too small. Also, 2026-01-31 and 2026-02-05 were just 5 days apart, part of the same crash, with overlapping 7-day windows (the -11.9% for January 31 already includes the plunge on February 5). Strictly speaking, there are only 2 independent samples, so it’s impossible to draw a real conclusion.
This week’s move doesn’t really count as “the same thing” either. Today the Fear Index is 11, and BTC is down 16.2% over four days (from 11-12 to a low of $62,018 on 11-15), but the worst single-day drop was just 7.2% on 11-14. That’s a slow grind lower, not a one-day flash crash.
With this kind of slow grind, are you in the “extreme fear is an opportunity” camp, or the “don’t catch a falling knife just yet” camp?
$BTC $ETH $SOL #恐慌指数 #Market Recap
Here are the 7-day outcomes for the 3 most recent cases:
2022-06-18: Fear Index 6, intraday drop of 13.5%, up 13.1% after 7 days;
2026-01-31: Fear Index 20, intraday drop of 9.9%, down 11.9% after 7 days;
2026-02-05: Fear Index 12, intraday drop of 14.6%, up 5.6% after 7 days.
The sample is too small. Also, 2026-01-31 and 2026-02-05 were just 5 days apart, part of the same crash, with overlapping 7-day windows (the -11.9% for January 31 already includes the plunge on February 5). Strictly speaking, there are only 2 independent samples, so it’s impossible to draw a real conclusion.
This week’s move doesn’t really count as “the same thing” either. Today the Fear Index is 11, and BTC is down 16.2% over four days (from 11-12 to a low of $62,018 on 11-15), but the worst single-day drop was just 7.2% on 11-14. That’s a slow grind lower, not a one-day flash crash.
With this kind of slow grind, are you in the “extreme fear is an opportunity” camp, or the “don’t catch a falling knife just yet” camp?
$BTC $ETH $SOL #恐慌指数 #Market Recap