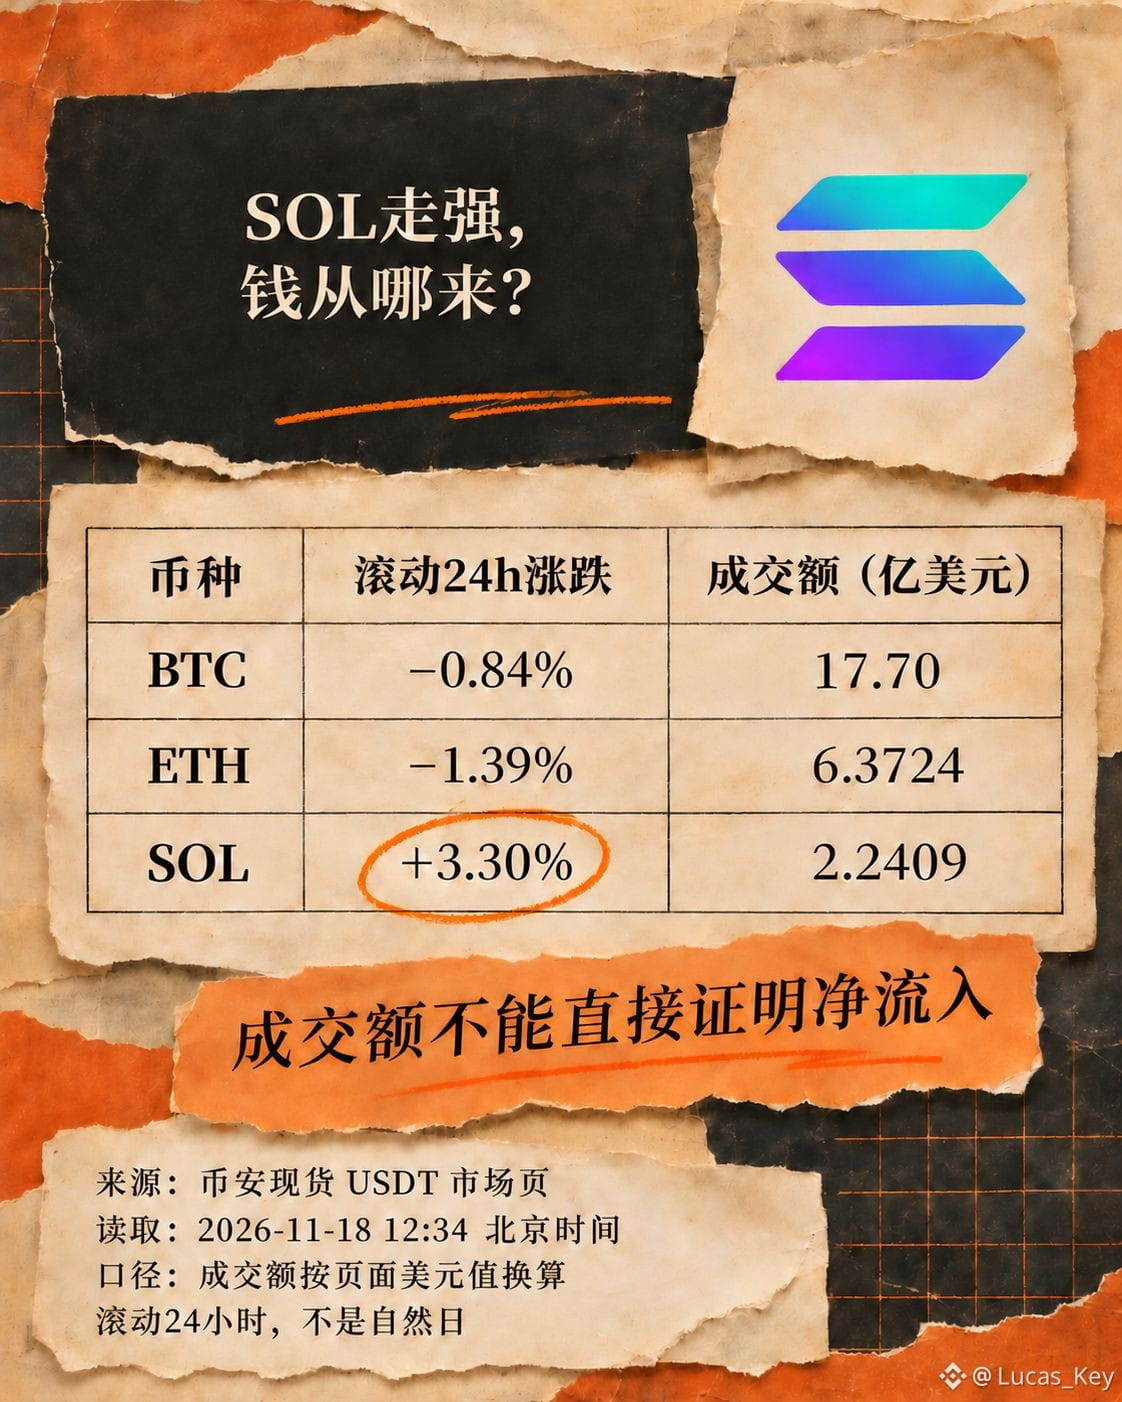
$SOL is up. Can we say directly that capital is moving out of Bitcoin and Ethereum and into it? At 12:34 Beijing time on November 18, I checked Binance’s spot USDT market page. The rolling 24-hour changes shown in the same snapshot were: SOL +3.30%, $BTC −0.84%, and $ETH −1.39%. The divergence is real, but this table does not prove where the capital came from.
Those who favor the “rotation” explanation point to genuine relative strength: while the larger coins were weak, SOL was still rising, which at least shows stronger price performance during this window. But there is clear evidence on the other side as well: the page showed trading volumes of about $1.770 billion for BTC, $637.24 million for ETH, and $224.09 million for SOL. These figures record trading volume, and every trade has both a buyer and a seller; they cannot be treated directly as net inflows, much less depicted as capital flowing from BTC and ETH to SOL.
What matters more to me is whether this explanation holds up to further testing: can SOL’s strength relative to BTC and ETH persist across multiple observation windows? Does the spot order book continue to absorb selling pressure? And do price and volume across different markets corroborate one another? If the advantage disappears quickly, the claim of “sustained rotation” should be downgraded. Even if the strength persists, evidence from accounts or fund flows is still needed to establish where the capital actually came from.
This article uses only the snapshot from that page. Trading volumes are converted from the dollar values shown on the page, retaining the displayed precision. The rolling 24-hour period is not a calendar day and does not represent real-time values at the time of publication. Risk warning: relative strength can reverse quickly, and trading volume on a single platform cannot represent fund flows across the entire market.
Those who favor the “rotation” explanation point to genuine relative strength: while the larger coins were weak, SOL was still rising, which at least shows stronger price performance during this window. But there is clear evidence on the other side as well: the page showed trading volumes of about $1.770 billion for BTC, $637.24 million for ETH, and $224.09 million for SOL. These figures record trading volume, and every trade has both a buyer and a seller; they cannot be treated directly as net inflows, much less depicted as capital flowing from BTC and ETH to SOL.
What matters more to me is whether this explanation holds up to further testing: can SOL’s strength relative to BTC and ETH persist across multiple observation windows? Does the spot order book continue to absorb selling pressure? And do price and volume across different markets corroborate one another? If the advantage disappears quickly, the claim of “sustained rotation” should be downgraded. Even if the strength persists, evidence from accounts or fund flows is still needed to establish where the capital actually came from.
This article uses only the snapshot from that page. Trading volumes are converted from the dollar values shown on the page, retaining the displayed precision. The rolling 24-hour period is not a calendar day and does not represent real-time values at the time of publication. Risk warning: relative strength can reverse quickly, and trading volume on a single platform cannot represent fund flows across the entire market.