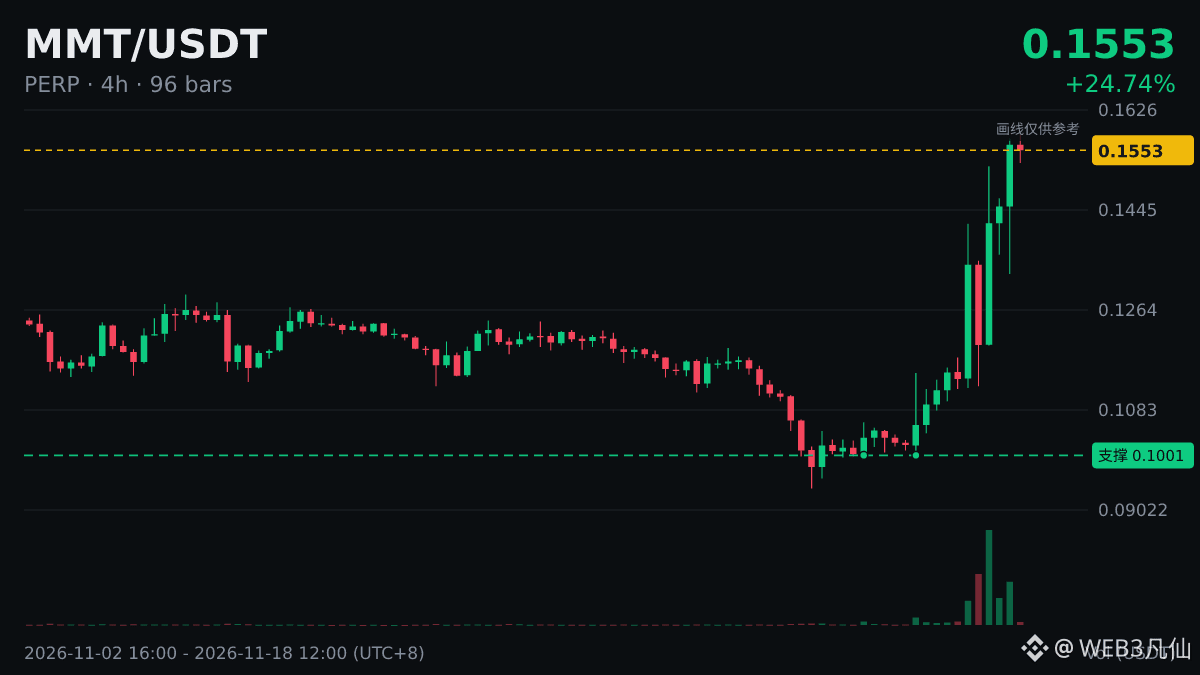
📐 Data: $MMT |4-hour RSI(14) 75.3|Overbought
· What it is: Simply put, RSI measures how much of the total price movement over a recent period came from gains: the more gains outweigh losses, the closer RSI gets to 100.
· How to read it: When RSI reaches an extreme zone, a more cautious response is to first consider the overall trend, where the key price levels are, and whether your position can withstand the market moving further in the same direction.
Knowing how to read indicators isn’t hard; the real challenge is sticking to your plan when the market gets extremely volatile.
#MMT
· What it is: Simply put, RSI measures how much of the total price movement over a recent period came from gains: the more gains outweigh losses, the closer RSI gets to 100.
· How to read it: When RSI reaches an extreme zone, a more cautious response is to first consider the overall trend, where the key price levels are, and whether your position can withstand the market moving further in the same direction.
Knowing how to read indicators isn’t hard; the real challenge is sticking to your plan when the market gets extremely volatile.
#MMT