#NEAR Multi-Timeframe Analysis: Is the Bottom In, or Is This Just a Technical Rebound?
1. Overall context
$NEAR /USDT currently: $3,361 (+4.54% in 24h). 24h volume ∼92.9M USDT, with buyers dominating at 57.21% versus 42.79% sellers.
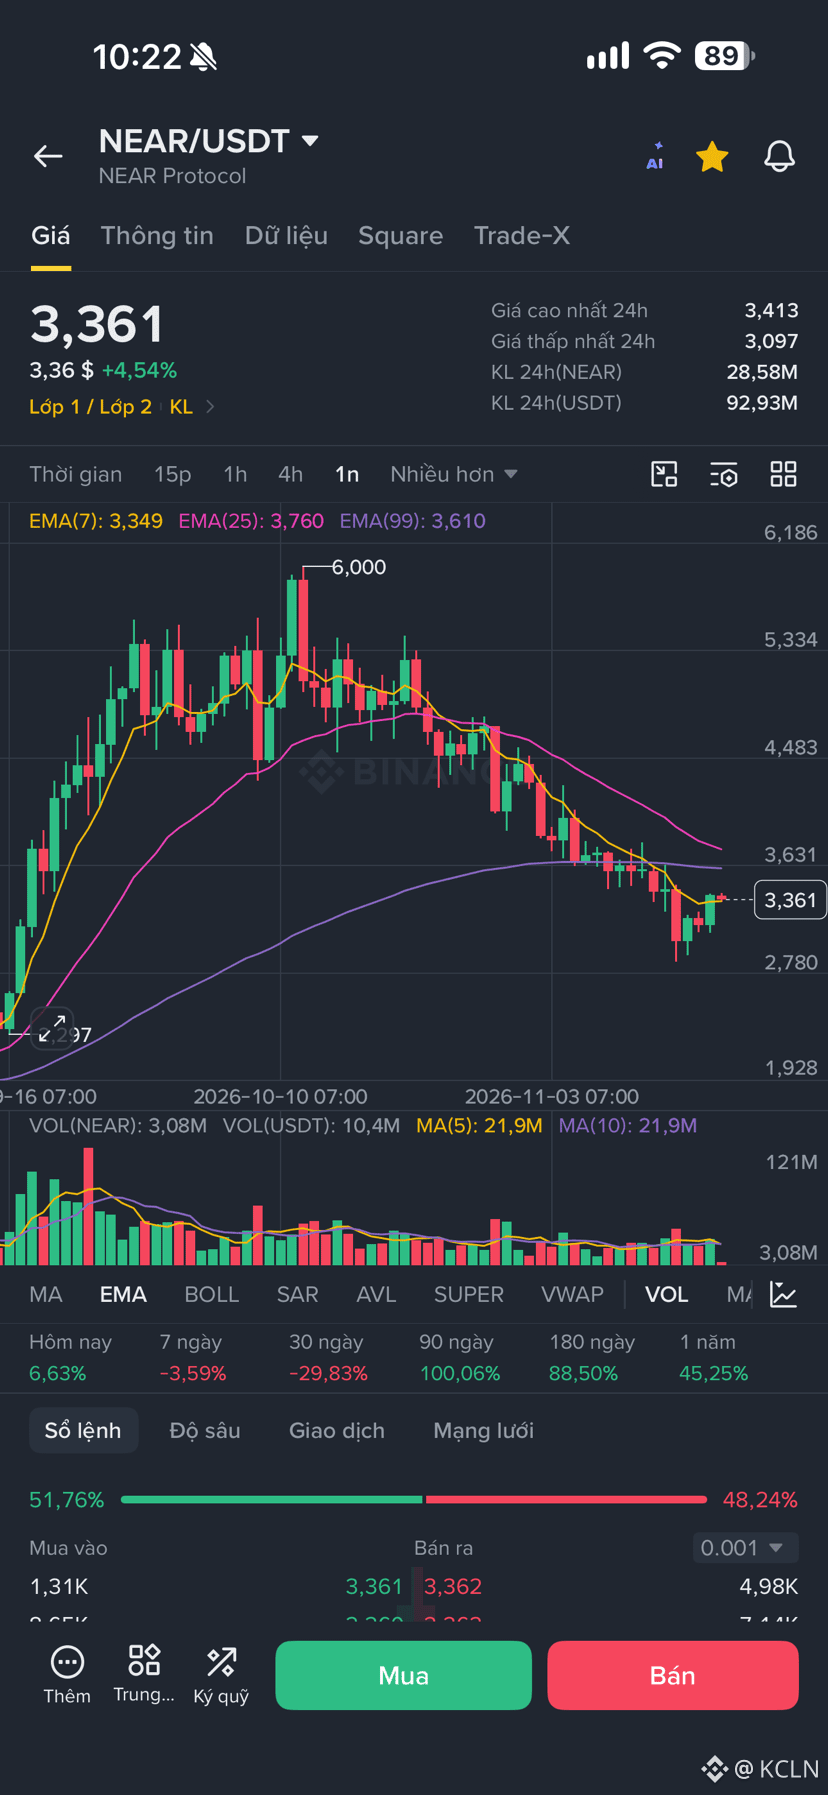
1D timeframe: Declined from a high of $6,000 to a low of $2,870 and is now recovering. Price remains below EMA25 at $3,760 and EMA99 at $3,610, so the long-term trend is still bearish.
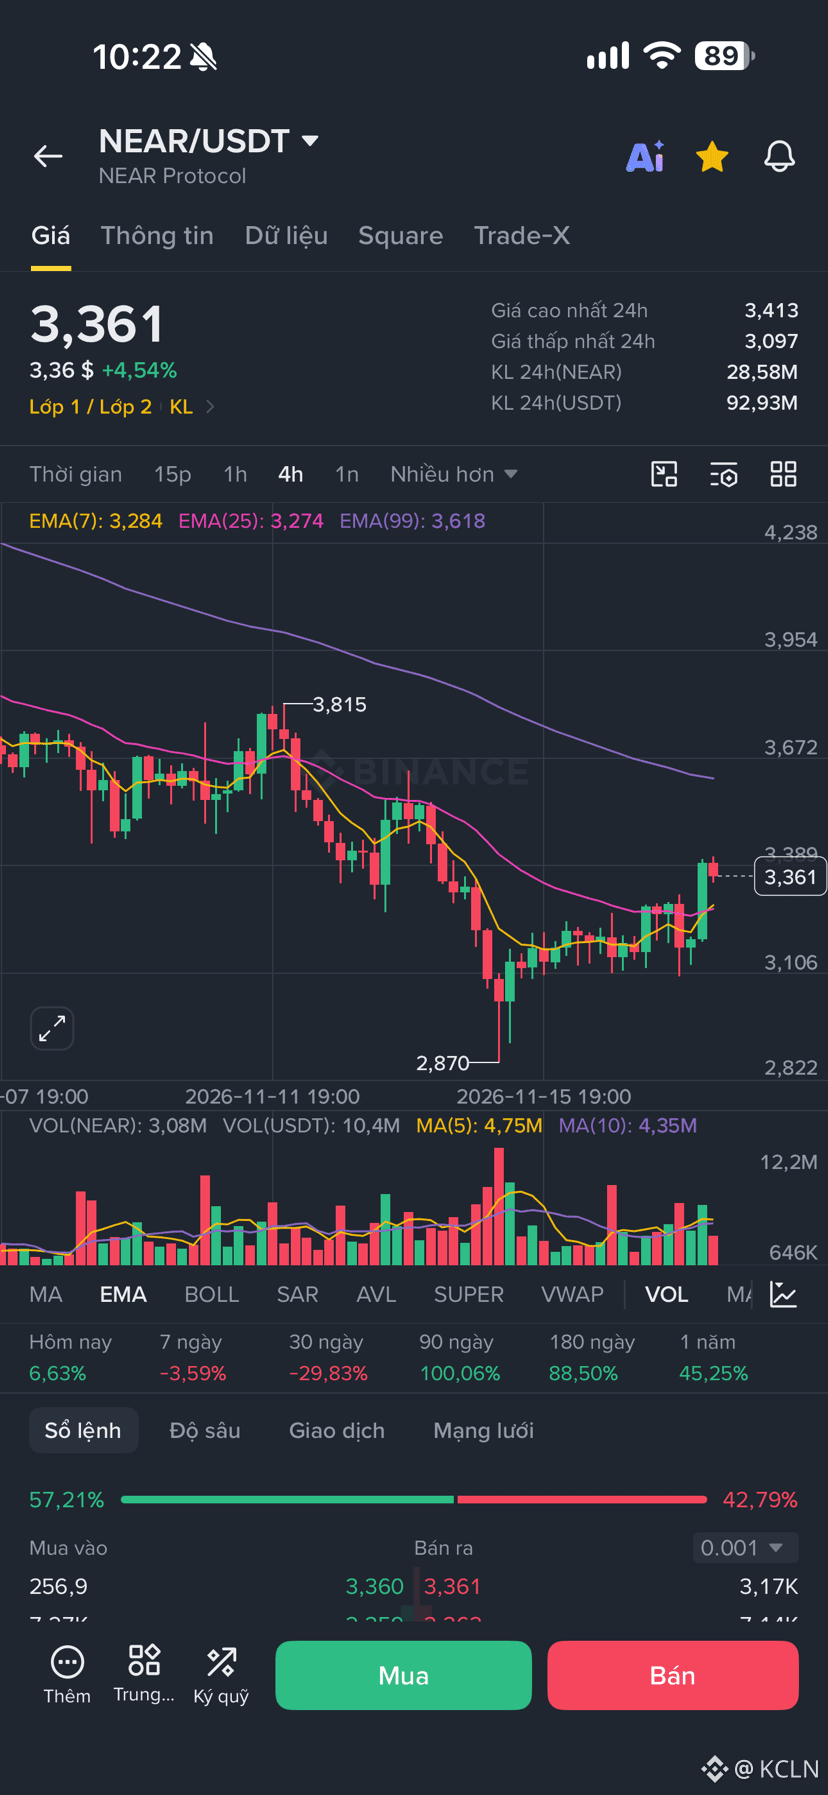
4H timeframe: Formed a low of $2,870 on 15/11 and bounced sharply +17% to $3,361. Price has just crossed above EMA7 at $3,284 and EMA25 at $3,274, signaling a short-term shift to bullish.
2. Detailed technical analysis
1D timeframe: The dominant trend is bearish, with a recovery underway. Price < EMA25 at $3,760 < EMA99 at $3,610. Resistance: $3,610, then $3,760 and $4,483. Support: $3,097, then $2,870.
4H timeframe: Short-term recovery trend. EMA7 has crossed above EMA25, but EMA99 at $3,618 is pressing just overhead. Resistance: $3,618, then $3,815. Support: $3,274, then $3,097.
3 points to note:
1. Bottom divergence + volume spike: The 4H timeframe formed a low of $2,870 with a long candle wick, accompanied by the highest volume in 2 weeks at 12.2M NEAR. This signals a liquidity sweep and dip-buying inflows.
2. 4H EMA99 is strong resistance: Price is approaching the 4H EMA99 around $3,618. This is also the price zone that saw a strong rejection in early November. If it fails to break through, a retest of $3,274 is highly likely.
3. Performance: NEAR is up 100.06% in 90 days but down 29.83% in 30 days. This means it is in a sharp correction within a larger uptrend.
3. Trading scenarios
Scenario 1: Recovery continues - 60% probability
Condition: 4H candle closes above $3,618 with volume greater than MA5 at 4.75M.
Targets: $3,815, then $4,238.
Invalidation: Price falls below $3,274.
Scenario 2: Retest of the bottom - 40% probability
Condition: Rejected at $3,618 and a strong red candle appears.
1. Overall context
$NEAR /USDT currently: $3,361 (+4.54% in 24h). 24h volume ∼92.9M USDT, with buyers dominating at 57.21% versus 42.79% sellers.
1D timeframe: Declined from a high of $6,000 to a low of $2,870 and is now recovering. Price remains below EMA25 at $3,760 and EMA99 at $3,610, so the long-term trend is still bearish.
4H timeframe: Formed a low of $2,870 on 15/11 and bounced sharply +17% to $3,361. Price has just crossed above EMA7 at $3,284 and EMA25 at $3,274, signaling a short-term shift to bullish.
2. Detailed technical analysis
1D timeframe: The dominant trend is bearish, with a recovery underway. Price < EMA25 at $3,760 < EMA99 at $3,610. Resistance: $3,610, then $3,760 and $4,483. Support: $3,097, then $2,870.
4H timeframe: Short-term recovery trend. EMA7 has crossed above EMA25, but EMA99 at $3,618 is pressing just overhead. Resistance: $3,618, then $3,815. Support: $3,274, then $3,097.
3 points to note:
1. Bottom divergence + volume spike: The 4H timeframe formed a low of $2,870 with a long candle wick, accompanied by the highest volume in 2 weeks at 12.2M NEAR. This signals a liquidity sweep and dip-buying inflows.
2. 4H EMA99 is strong resistance: Price is approaching the 4H EMA99 around $3,618. This is also the price zone that saw a strong rejection in early November. If it fails to break through, a retest of $3,274 is highly likely.
3. Performance: NEAR is up 100.06% in 90 days but down 29.83% in 30 days. This means it is in a sharp correction within a larger uptrend.
3. Trading scenarios
Scenario 1: Recovery continues - 60% probability
Condition: 4H candle closes above $3,618 with volume greater than MA5 at 4.75M.
Targets: $3,815, then $4,238.
Invalidation: Price falls below $3,274.
Scenario 2: Retest of the bottom - 40% probability
Condition: Rejected at $3,618 and a strong red candle appears.