🔥 $TRX Technical Update: Key Levels & Momentum Breakdown
📊 1. Market Snapshot
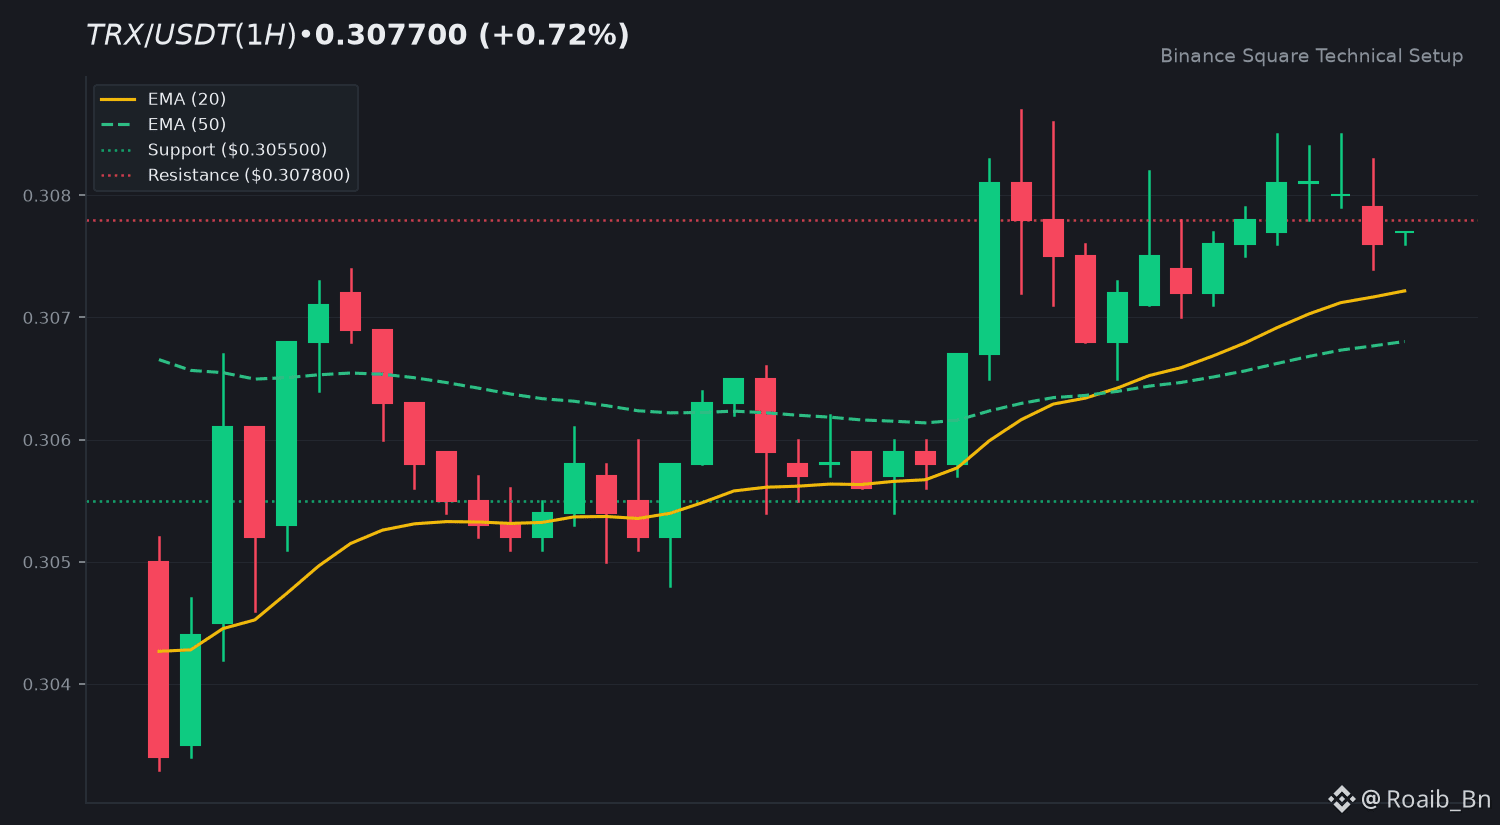
$TRX is currently trading at $0.3077, reflecting a modest 24-hour gain of +0.72%. Price action has fluctuated between a daily high of $0.3087 and a low of $0.3048, backed by a 24h quote volume of $22.62M USDT.
📈 2. Technical Momentum & Indicator Bias
The broader trend remains in a steady upward channel. The EMA 20 rests at $0.3072, sitting just above the EMA 50 at $0.3068, showing tight alignment. The RSI (14) prints at 57.54, indicating mild bullish momentum without extreme overbought conditions. The MACD histogram reads +0.0000, signaling a temporary equilibrium between buyers and sellers amid low volume consolidation (0.08x 20-SMA ratio).
🎯 3. Key Technical Levels to Watch
• 🟢 Resistance Zone: $0.3078 immediate overhead barrier, with upper targets near the $0.3087 daily high.
• 🔴 Support Zone: $0.3055 primary support floor protecting against minor retracements.
• 🛡️ Pivot Confluence: The EMA 20 ($0.3072) serves as the critical near-term structural pivot.
💡 4. Technical Takeaway & Risk Management
Price compression near current moving averages highlights a potential decision zone. Traders should monitor volume expansion alongside reactions at the EMA 20 and resistance boundary for directional clues.
💬 5. Community Discussion
What is your technical outlook for $TRX this week? Are you accumulating or waiting for confirmation? Drop your thoughts below! 👇
⚠️ 6. Disclaimer
Educational technical analysis only. Not financial advice (NFA). Crypto markets involve risk. Always DYOR.
$TRX #TRX #BinanceSquare
📊 1. Market Snapshot
$TRX is currently trading at $0.3077, reflecting a modest 24-hour gain of +0.72%. Price action has fluctuated between a daily high of $0.3087 and a low of $0.3048, backed by a 24h quote volume of $22.62M USDT.
📈 2. Technical Momentum & Indicator Bias
The broader trend remains in a steady upward channel. The EMA 20 rests at $0.3072, sitting just above the EMA 50 at $0.3068, showing tight alignment. The RSI (14) prints at 57.54, indicating mild bullish momentum without extreme overbought conditions. The MACD histogram reads +0.0000, signaling a temporary equilibrium between buyers and sellers amid low volume consolidation (0.08x 20-SMA ratio).
🎯 3. Key Technical Levels to Watch
• 🟢 Resistance Zone: $0.3078 immediate overhead barrier, with upper targets near the $0.3087 daily high.
• 🔴 Support Zone: $0.3055 primary support floor protecting against minor retracements.
• 🛡️ Pivot Confluence: The EMA 20 ($0.3072) serves as the critical near-term structural pivot.
💡 4. Technical Takeaway & Risk Management
Price compression near current moving averages highlights a potential decision zone. Traders should monitor volume expansion alongside reactions at the EMA 20 and resistance boundary for directional clues.
💬 5. Community Discussion
What is your technical outlook for $TRX this week? Are you accumulating or waiting for confirmation? Drop your thoughts below! 👇
⚠️ 6. Disclaimer
Educational technical analysis only. Not financial advice (NFA). Crypto markets involve risk. Always DYOR.
$TRX #TRX #BinanceSquare