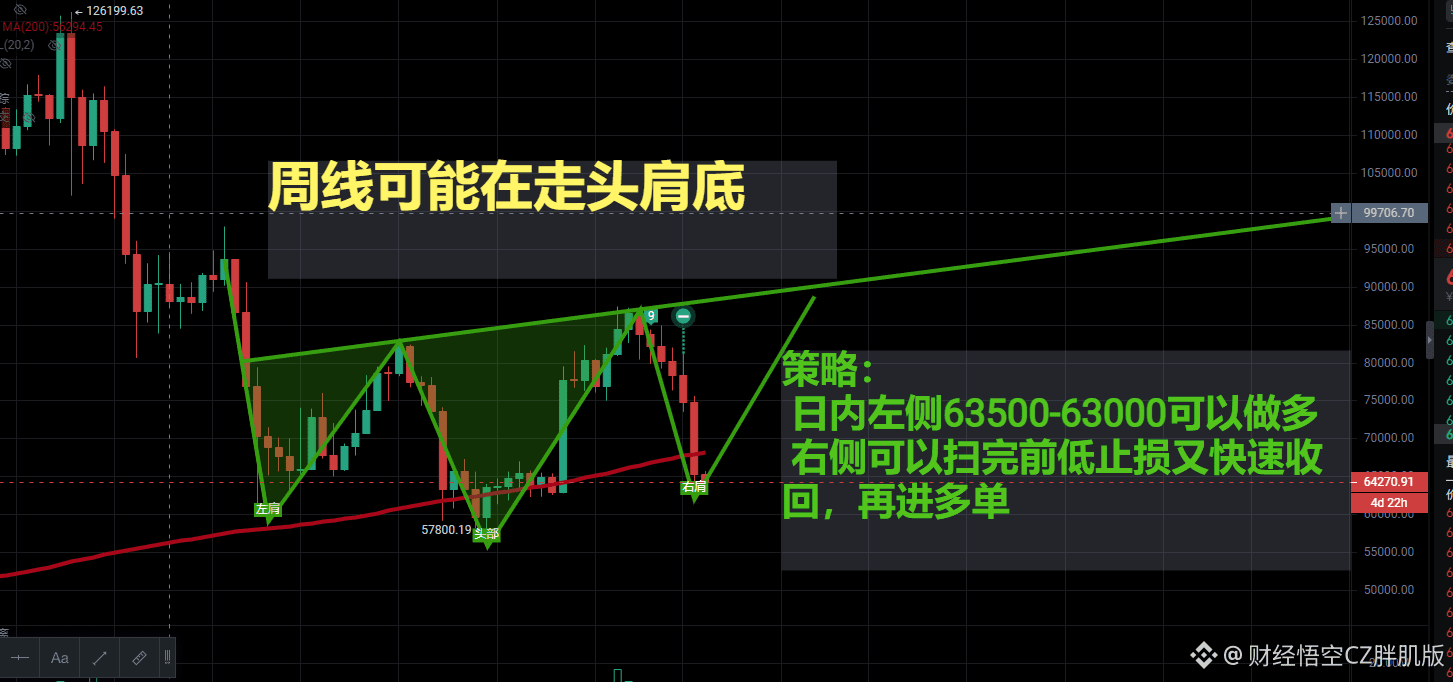

Could Bitcoin be forming the right shoulder of an inverse head-and-shoulders pattern on the weekly chart?
The weekly chart may be forming an inverse head-and-shoulders pattern: the February low at 60,176 is the left shoulder, and the June low at 57,700 is the head. The current pullback has held above the previous low, making this the right shoulder.
The daily chart has had three consecutive high-volume bearish candles. On the 1-hour chart, panic selling pushed the price below the previous low of 63,900, but it then recovered slightly. A potential bear trap is taking shape, but it’s not confirmed yet.
A lot of stop-loss orders from dip-buying longs have built up below the previous low in the hourly consolidation range. The price will likely dip once more toward 62,000 to sweep those stops before bouncing.
📍 Resistance: 65,500–66,000
Only after the candle body holds firmly above 66K can the hoped-for upward move begin.
📍 Intraday support: 63,500–63,000
Strategy:
1️⃣ Consider going long on the left side of the move at 63,500–63,000.
2️⃣ On the right side, wait for the price to sweep the stops below the previous low and quickly recover, then enter a long.
The Fear Index is currently at 10, and the AHR99 dollar-cost averaging indicator signals a dip-buying window. The upcoming China-Russia-US leaders’ meeting on the 19th and Anthropic’s listing on Thursday could both affect short-term market trends.
#英伟达财报大超预期,Q4营收展望1300亿美元 #AnthropicIPO需求强劲,发行价或超80美元 #英伟达Q3营收近93%来自数据中心,增长势头能否持续? $BTC $ETH
The weekly chart may be forming an inverse head-and-shoulders pattern: the February low at 60,176 is the left shoulder, and the June low at 57,700 is the head. The current pullback has held above the previous low, making this the right shoulder.
The daily chart has had three consecutive high-volume bearish candles. On the 1-hour chart, panic selling pushed the price below the previous low of 63,900, but it then recovered slightly. A potential bear trap is taking shape, but it’s not confirmed yet.
A lot of stop-loss orders from dip-buying longs have built up below the previous low in the hourly consolidation range. The price will likely dip once more toward 62,000 to sweep those stops before bouncing.
📍 Resistance: 65,500–66,000
Only after the candle body holds firmly above 66K can the hoped-for upward move begin.
📍 Intraday support: 63,500–63,000
Strategy:
1️⃣ Consider going long on the left side of the move at 63,500–63,000.
2️⃣ On the right side, wait for the price to sweep the stops below the previous low and quickly recover, then enter a long.
The Fear Index is currently at 10, and the AHR99 dollar-cost averaging indicator signals a dip-buying window. The upcoming China-Russia-US leaders’ meeting on the 19th and Anthropic’s listing on Thursday could both affect short-term market trends.
#英伟达财报大超预期,Q4营收展望1300亿美元 #AnthropicIPO需求强劲,发行价或超80美元 #英伟达Q3营收近93%来自数据中心,增长势头能否持续? $BTC $ETH