$ICNT
🚀 ICNT/USDT Technical Analysis: Massive Breakout & Potential Trade Setup!
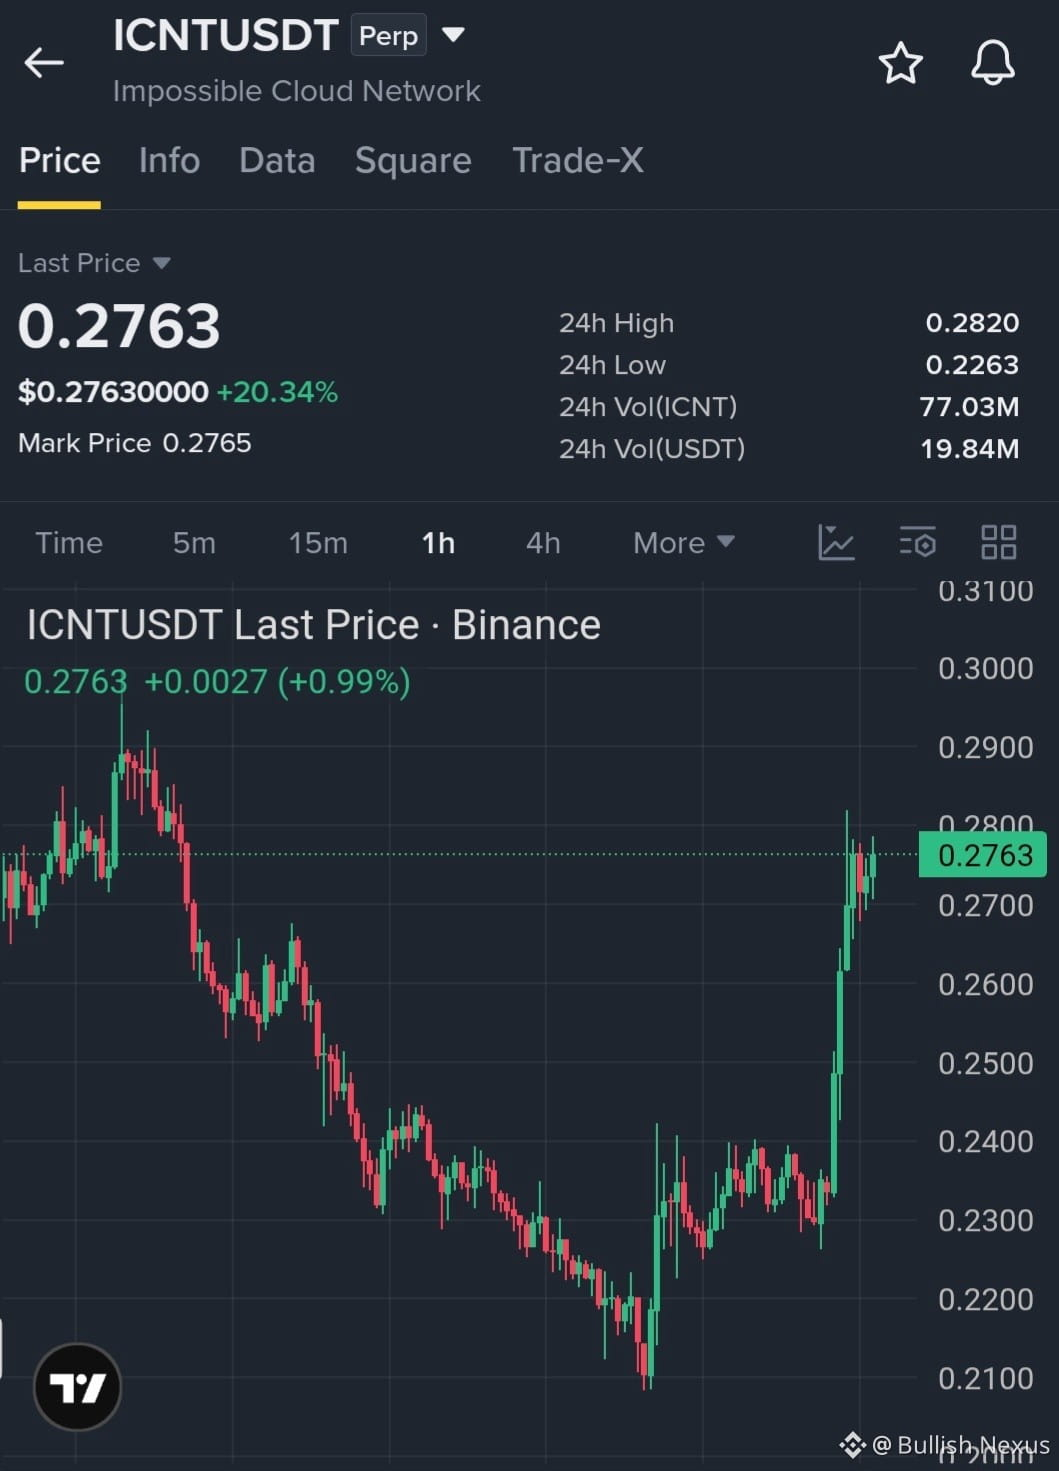
$ICNT is showing explosive bullish momentum, surging over +20% in the last 24 hours after breaking out strongly from recent lows around $0.2084. Both 1H and 4H timeframes have flipped bullish, but with indicators running hot, here is my professional game plan for the next move.
📊 Market Structure & Overview:
Current Price: ~$0.2773
1H Chart: Clean impulsive break above all major moving averages (MA 7, 25, 99) and the 1H Supertrend ($0.2458). High volume spike confirming strong buyer interest.
4H Chart: Successfully crossed the 4H Supertrend ($0.2266) and testing crucial macro resistance near the 4H MA(99) (~$0.2598 - $0.2700).
RSI & Momentum: RSI(6) on 1H (~82) and StochRSI are in overbought territory, indicating a potential short-term cooling-off or pullback before the next leg up.
🎯 Trade Plan & Strategy:
Option A: Pullback Long (Recommended Strategy)
Since the asset is slightly overextended in the short term, waiting for a healthy retest of support is the safest approach.
Entry Zone (Dips): $0.2500 – $0.2580
Stop Loss (SL): $0.2380 (Strict control below 1H structural support/MA99)
Take Profit Targets:
TP1: $0.2850
TP2: $0.3150
TP3: $0.3500+
Option B: Breakout Continuation
If volume remains exceptionally heavy and price punches right through resistance:
Entry Trigger: 1H candle close cleanly above $0.2820 (24h High).
Stop Loss (SL): $0.2650
Take Profit Targets: $0.3100 / $0.3400
⚠️ Risk Management: Always use proper position sizing and manage leverage carefully. Overbought oscillators can trigger sharp local wicks. Protect your capital!
#icntusdt
🚀 ICNT/USDT Technical Analysis: Massive Breakout & Potential Trade Setup!
$ICNT is showing explosive bullish momentum, surging over +20% in the last 24 hours after breaking out strongly from recent lows around $0.2084. Both 1H and 4H timeframes have flipped bullish, but with indicators running hot, here is my professional game plan for the next move.
📊 Market Structure & Overview:
Current Price: ~$0.2773
1H Chart: Clean impulsive break above all major moving averages (MA 7, 25, 99) and the 1H Supertrend ($0.2458). High volume spike confirming strong buyer interest.
4H Chart: Successfully crossed the 4H Supertrend ($0.2266) and testing crucial macro resistance near the 4H MA(99) (~$0.2598 - $0.2700).
RSI & Momentum: RSI(6) on 1H (~82) and StochRSI are in overbought territory, indicating a potential short-term cooling-off or pullback before the next leg up.
🎯 Trade Plan & Strategy:
Option A: Pullback Long (Recommended Strategy)
Since the asset is slightly overextended in the short term, waiting for a healthy retest of support is the safest approach.
Entry Zone (Dips): $0.2500 – $0.2580
Stop Loss (SL): $0.2380 (Strict control below 1H structural support/MA99)
Take Profit Targets:
TP1: $0.2850
TP2: $0.3150
TP3: $0.3500+
Option B: Breakout Continuation
If volume remains exceptionally heavy and price punches right through resistance:
Entry Trigger: 1H candle close cleanly above $0.2820 (24h High).
Stop Loss (SL): $0.2650
Take Profit Targets: $0.3100 / $0.3400
⚠️ Risk Management: Always use proper position sizing and manage leverage carefully. Overbought oscillators can trigger sharp local wicks. Protect your capital!
#icntusdt