

Disclosure: It is not financial advice
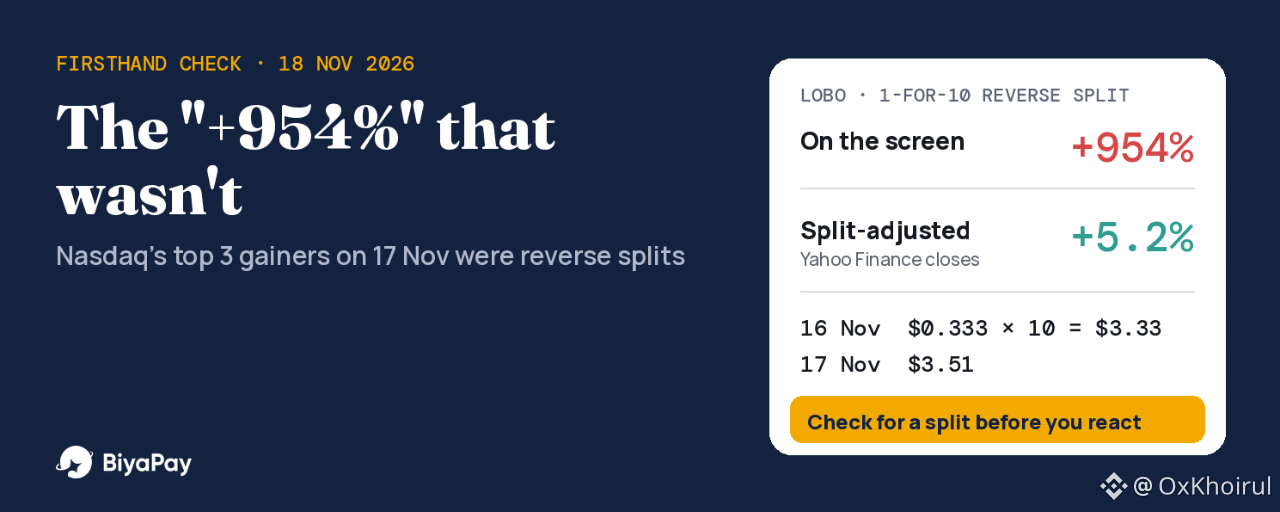
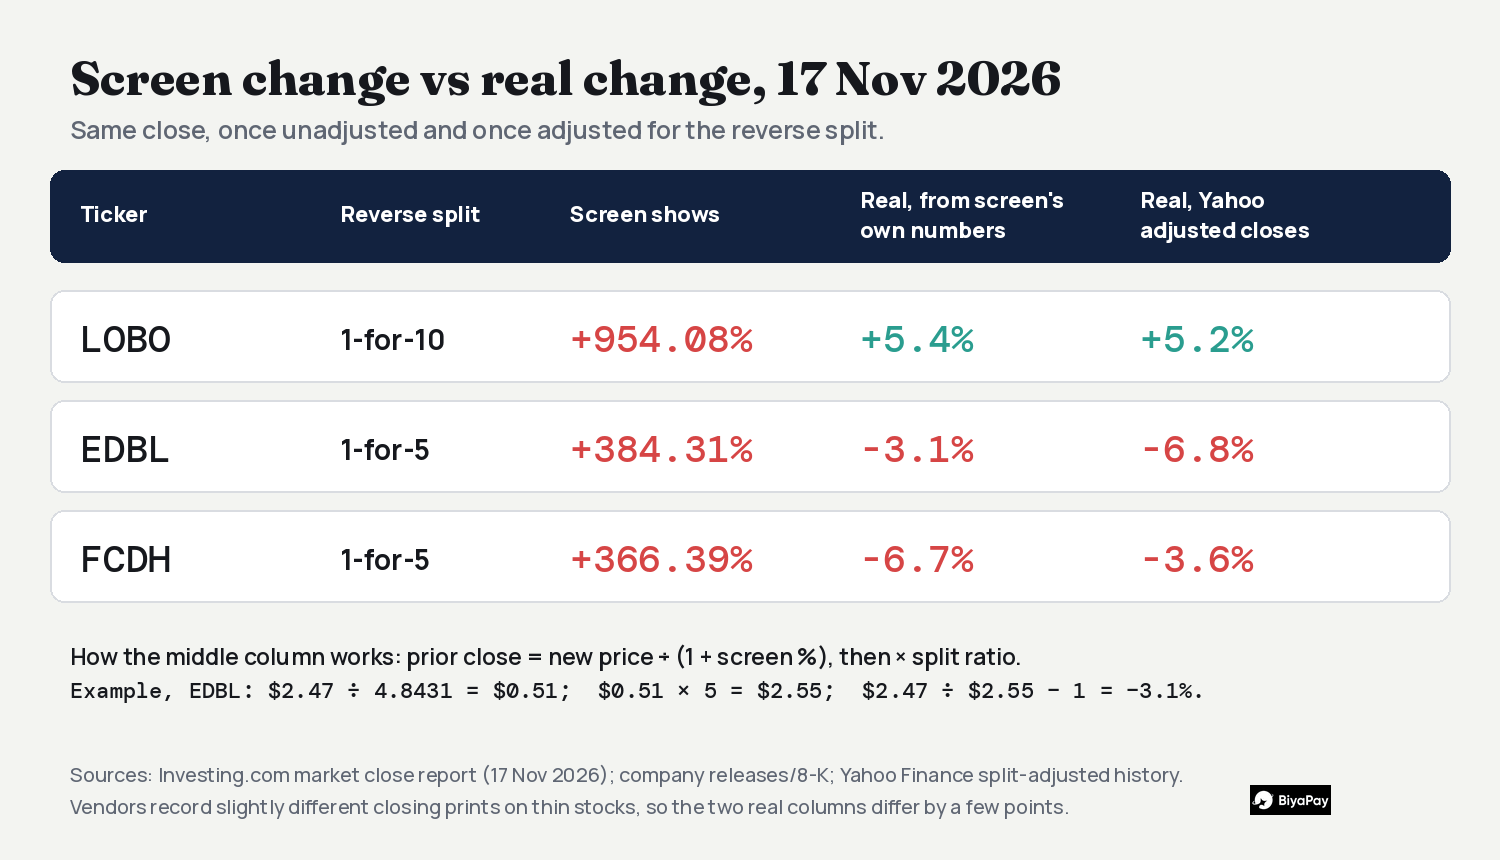
On Tuesday 17 November, Investing.com's market-close report listed the best performers on the Nasdaq Composite: Lobo Technologies (LOBO) up 954.08% to $3.51, Edible Garden (EDBL) up 384.31% to $2.47, and Forcendra (FCDH) up 366.39% to $2.56. If you saw that list on a quick scan, you could be forgiven for thinking three stocks had just tripled or better in a day.
I checked each one against company announcements and a split-adjusted price history. All three had done a reverse stock split that same week. None of them actually rose more than 6%. Two of them fell.
This is a screen problem, not a stock problem, and it matters because there is a mirror-image version coming this week for a very large company. I will get to that below.
What a reverse split does to the price on your screen
A reverse split combines shares. In a 1-for-10 split, ten old shares become one new share, and the price per share is multiplied by ten. The company is worth the same before and after; only the number of shares and the price per share change. BiyaPay's Help Center describes it the same way: the total market capitalisation stays unchanged while the share count and price per share are adjusted.
The trouble starts when a data feed compares today's post-split price with yesterday's pre-split close without adjusting it. A stock that was $0.33 yesterday and is $3.51 today looks like +954%. It is really $3.33 yesterday (after multiplying by 10) and $3.51 today.
The three names, checked
LOBO: 1-for-10 consolidation, effective 17 November (company release of 12 Nov and a Nasdaq Trader corporate-actions alert of 13 Nov). Shares outstanding went from 15,041,938 to about 1,504,194.
EDBL: 1-for-5 reverse split, effective 12:01 a.m. ET on 17 November (company 8-K).
FCDH: 1-for-5 reverse share split, effective 16 November, with split-adjusted trading from 17 November (company release of 13 Nov).
To get the real daily change, I did it two ways. First, I took the screen's own numbers: the implied prior close is the new price divided by (1 + the screen's percentage), then multiplied by the split ratio. Second, I compared Yahoo Finance's split-adjusted closes for 16 and 17 November.
LOBO: screen +954.08%. Implied prior close $0.333, adjusted to $3.33, so about +5.4%. Yahoo adjusted: $3.336 to $3.510, +5.2%.
EDBL: screen +384.31%. Implied prior close $0.51, adjusted to $2.55, so about -3.1%. Yahoo adjusted: $2.649 to $2.470, -6.8%.
FCDH: screen +366.39%. Implied prior close $0.549, adjusted to $2.74, so about -6.7%. Yahoo adjusted: $2.655 to $2.560, -3.6%.
The two methods disagree by a few points on EDBL and FCDH, which is what you would expect when two data vendors record slightly different closing prints for a thinly traded stock. They agree on the part that matters: single-digit moves, not triple-digit gains.
One more number puts it in perspective. LOBO has about 1.5 million shares after the split. At $3.51 that is a market value of roughly $5.3 million. Before the split it was 15.04 million shares at about $0.33, which is roughly $5.0 million. The company's size did not change by a factor of ten. The label on each share did.
Not every extreme number is an illusion
The same Investing.com report listed three big losers: Golden Heaven (GDHG) down 81.57% to $0.29, Cue Biopharma (CUE) down 79.93% to $2.83, and Scilex (SCLX) down 48.64% to $0.64. I checked Yahoo Finance's split records for those three and found no splits. Those moves look real. I did not research why they happened, so I will not guess.
That is the point of the check. A huge percentage is a reason to look, not a reason to conclude either way. Sometimes it is an artifact, and sometimes the stock really did lose most of its value in a day.
Why companies do reverse splits
SunPower (SPWR) is a current example. It announced a 1-for-35 reverse split effective at 4:01 p.m. ET on 17 November, with split-adjusted trading starting today, 18 November, and said the purpose is to regain compliance with the $1.00 minimum bid price on Nasdaq. Accuray said much the same about its 1-for-40 split on 9 November.
SPWR closed at $0.0968 on 17 November. Multiply by 35 and the equivalent post-split price is about $3.39. A screen that does not adjust would be able to show a gain of roughly 3,400% for a company whose value did not move because of the split. I expect to see that on some lists soon, but I have not verified how any particular platform will display it.
The forward split mirror image: Sandisk on 20 November
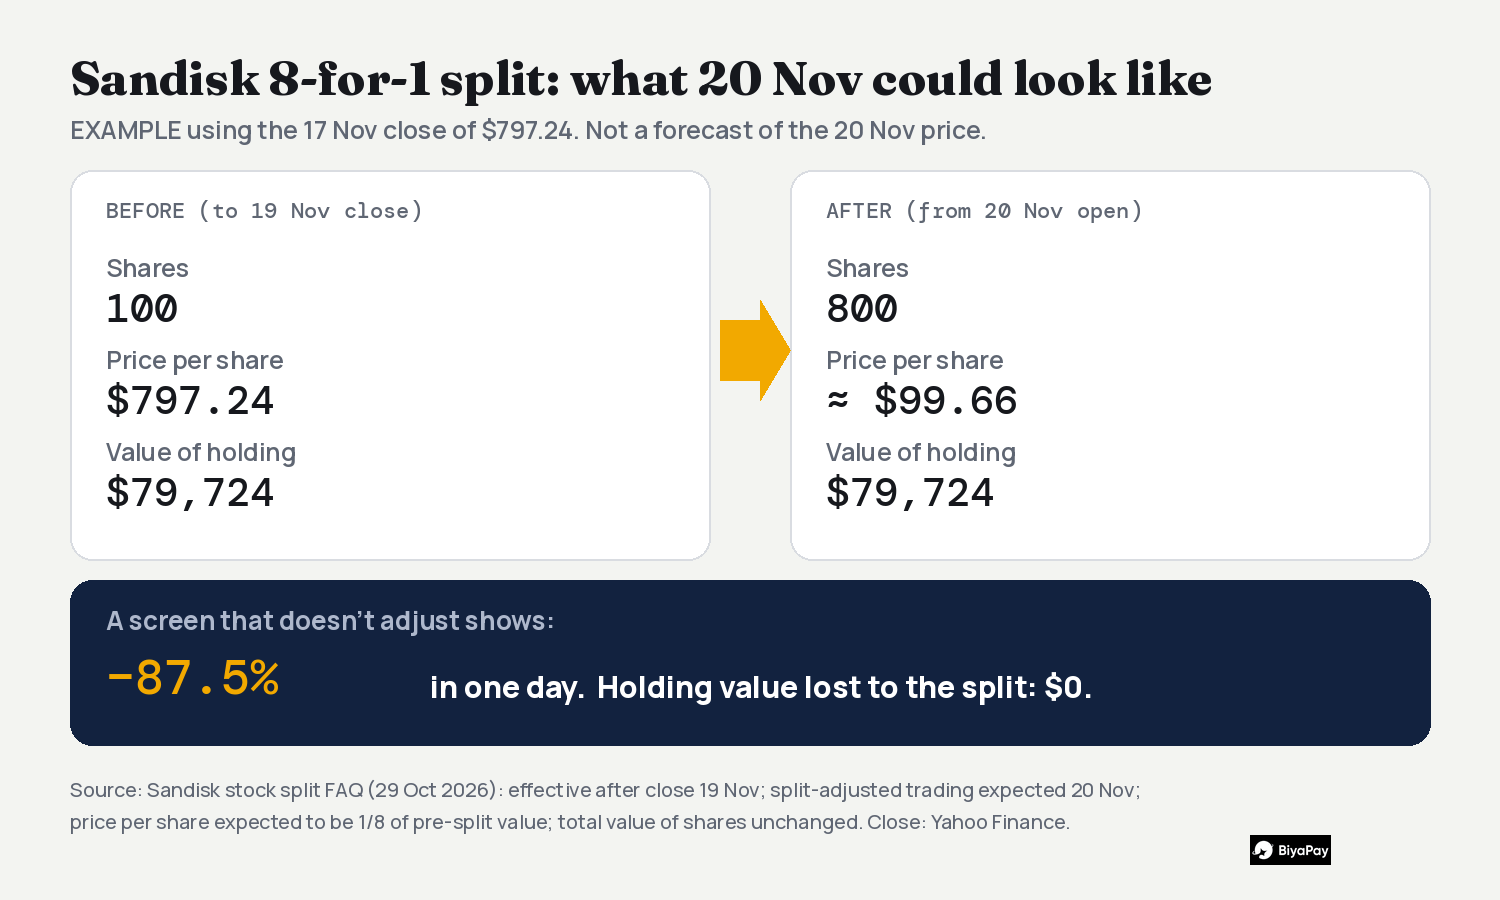
Forward splits do the opposite. Sandisk announced an 8-for-1 forward split, effective after the Nasdaq close on 19 November, with trading expected to begin on a split-adjusted basis when the market opens on 20 November. Its own FAQ says the price per share is expected to fall to one-eighth of the pre-split value, the number of shares will be multiplied by eight, and the total value of your holding stays equal.
SNDK closed at $797.24 on 17 November. Here is the arithmetic, using that close as an example (not a forecast of where it will trade):
100 shares at $797.24 = $79,724
After the split: 800 shares at about $99.66 = $79,724
Price per share change: -87.5%
Value of your holding because of the split: $0
A platform or chart that does not adjust for the split would show an 87.5% one-day drop on 20 November. If you only glance at the percentage, it looks like a crash. It is not one.
Fractions are treated differently by different companies
This part is easy to miss. In the LOBO and EDBL announcements, fractional shares are rounded up to the next whole share. In SunPower's announcement, holders who would receive a fraction get a cash payment instead, based on the 17 November closing price.
Take 100 shares of SPWR. Divided by 35, that is 2.857 shares. Under cash-in-lieu you end up with 2 shares plus cash for the 0.857. Under a round-up rule like LOBO's 1-for-10, a holder of 7 shares would end up with 1 share, and a holder of 12 shares would end up with 2 (1.2 rounded up). Small holders are the ones affected, and the rule is set in each company's announcement, not by a general standard. How your own broker handles it is something I cannot verify from outside, so read the notice.
My opinion
I treat any one-day move above about 100% as a question, not a signal. The first thing I check is whether there was a split or another corporate action, and the quickest places are the company's press release and the exchange's corporate-actions notices. Only after that do I look at the move itself.
The risk runs both ways. Reading an adjusted-away "gain" as momentum can pull you into a stock that actually fell that day. Reading Sandisk's split on 20 November as a collapse could push you to sell something whose value did not change because of the split.
When this applies, and when it does not
This applies to any stock that has a split or reverse split on the date you are looking at, and to screens, alerts and top-gainer lists that compare raw closing prices. It does not apply to a stock with no split on the calendar. For those, a move of that size is real, whatever caused it. It also says nothing about whether a split is good or bad for the company. A reverse split is often done because the price fell below an exchange's minimum, which is a fact about the past, not a prediction.
Checklist I use
If a move is above 100% in a day, search for the company's press release and the exchange's corporate-actions notice first
Use a split-adjusted chart, not a one-line percentage
Do the math yourself: new price multiplied by the split ratio (reverse) or divided by it (forward), compared with yesterday's close
Compare market value before and after; it should not jump because of the split
Read how fractions are handled before you hold a small number of shares
After the effective date, check your own share count and cost price in your account. BiyaPay's Help Center says the market cap is unchanged by a split; I could not verify how the app shows the adjustment, so check it yourself