

@
Come on, let's uncover the key to the game!
One is waiting for an upward breakout, another is bracing for a fresh drop, and a third is lost in the news and forecasts. Every time they open the chart, they find a different story!
Alright, come join me on the terrace. Let's put the noise aside and talk numbers. How could we move up? Where could we fall from here? And most importantly, what’s the point that separates the two scenarios?
Let’s draw a thick line under this number:
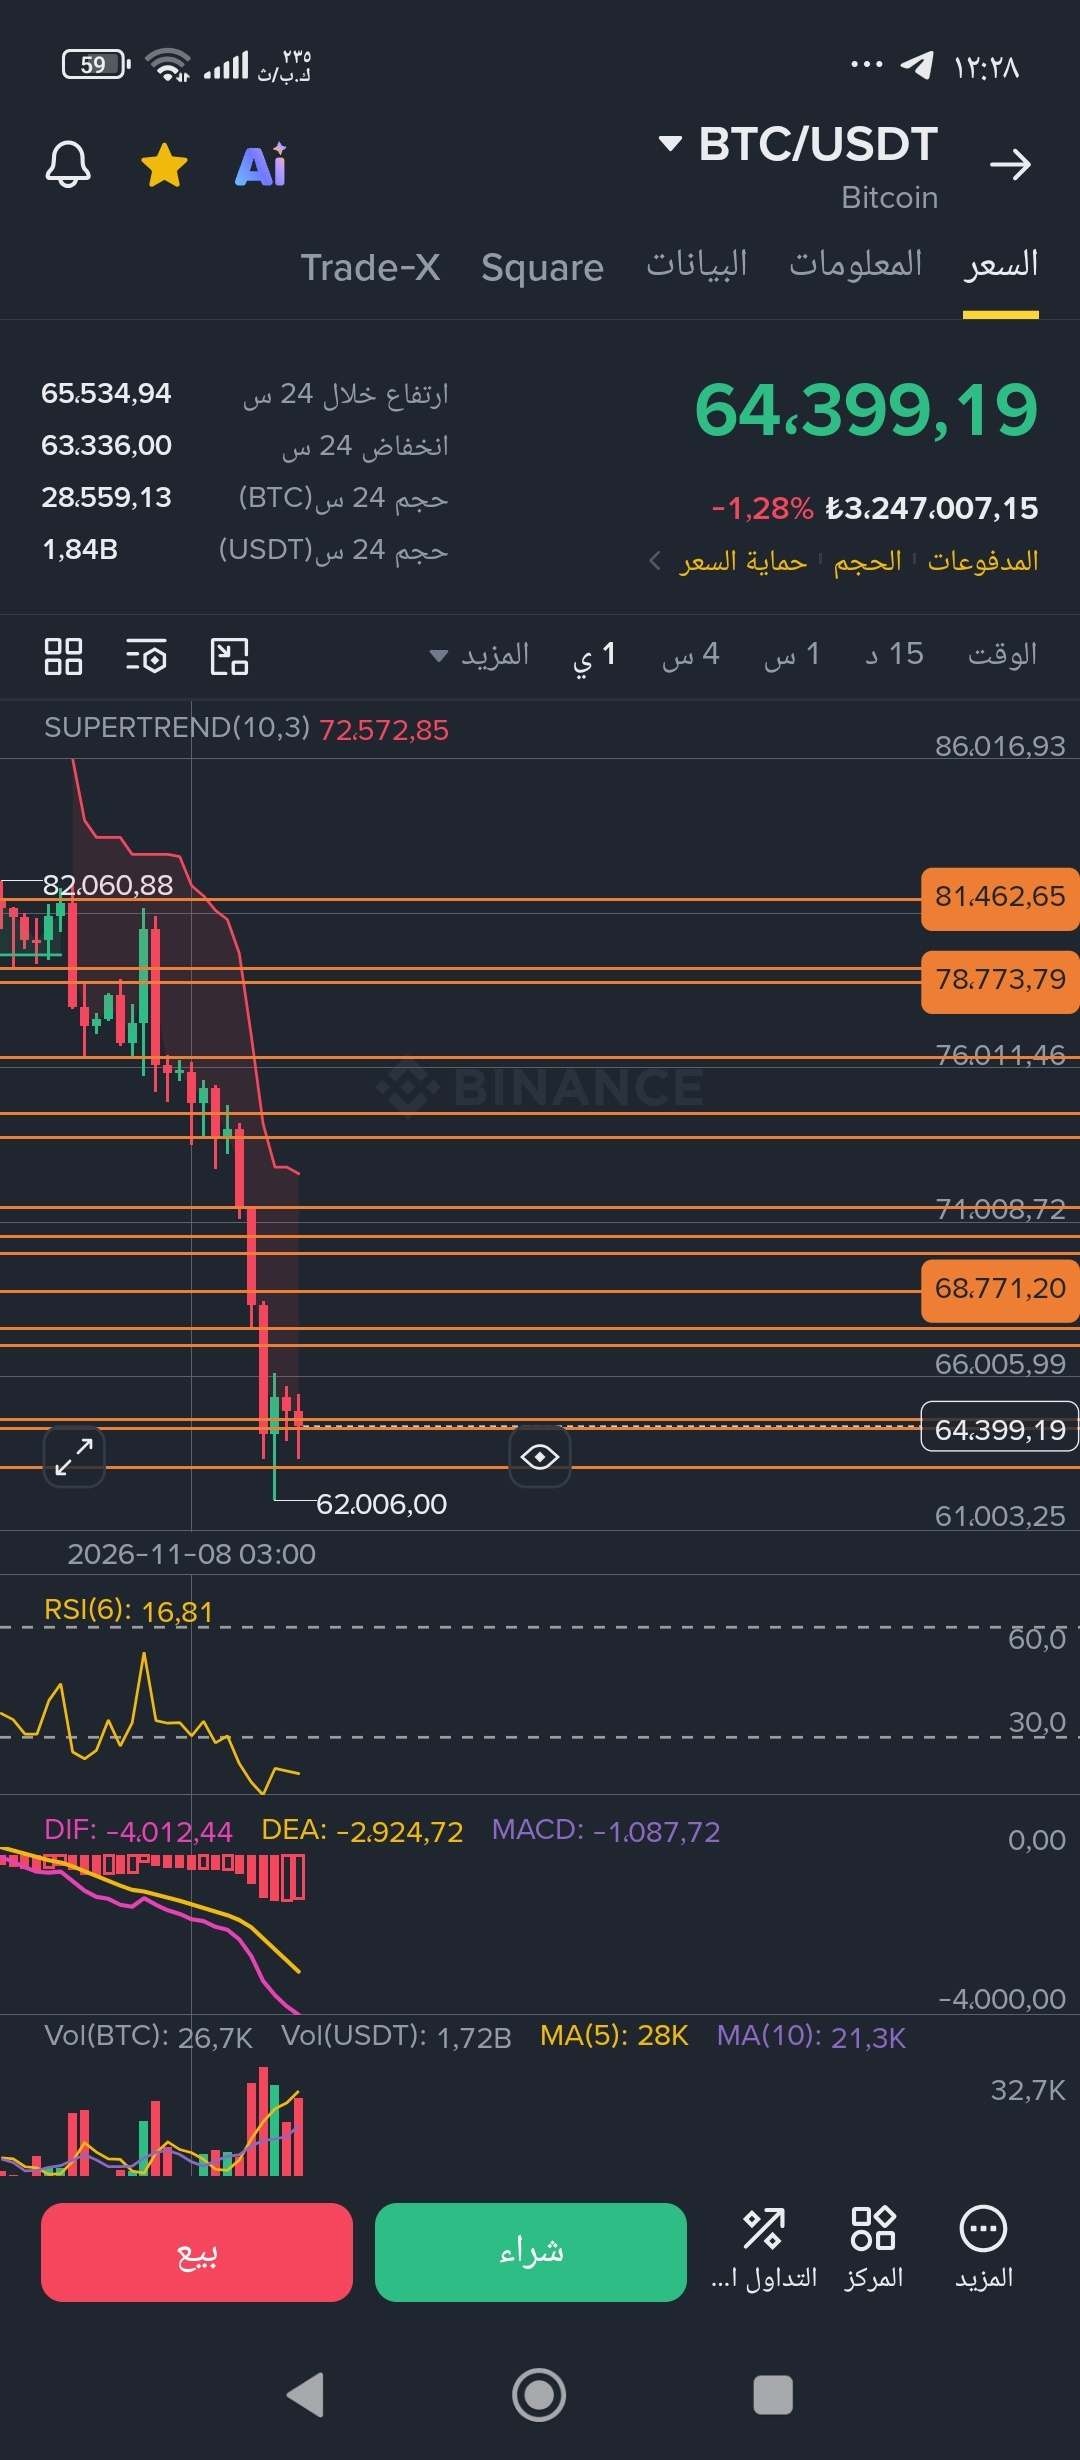
$64,630
This is the key to this phase in my analysis: the pivot point from which the bullish scenario and the scenario of continued correction branch off.
🟢 First: The bullish scenario... How do we read the road ahead?
As long as we hold $64,630 and don’t break below it with consecutive closes, there remains a possibility of launching from here with bullish momentum.
But the road isn’t clear of tests. There are key levels where we need to pause and assess price action and liquidity.
Stage one: Testing momentum
$67,560–$68,770–$69,900.
Here, I don’t want to watch price alone; I also want to keep a close eye on volume:
Is buying momentum continuing to flow as price advances, or are we starting to see volume drain away even as price keeps rising?
Because a rising price alone isn’t enough to judge the strength of the move.
Stage two: From a rebound to an attempted trend reversal
$71,500: A breakout and a close above it would signal an attempt to reverse the overall trend.
$73,630: The most important decision point and dividing line.
$74,500: Here, we want to see resistance turn into a strong support zone that is difficult to break.
If that happens, we’ll be seeing an important development in the market structure, with the possibility of shifting from a bearish structure to a bullish one.
Stage three: Testing the strength of the new structure
In our reading, $76,320 is the safety point for the bullish structure.
Then we reach a new zone where we can test the strength of the move:
$78,770–$79,250.
Is volume still supporting the rise, or is momentum starting to fade and leak away?
Here, we’ll find out whether the move has enough strength to continue.
Stage four: Are we close to making a new high?
A breakout above $81,460 and holding above it would open the way to test the previous high at $87,300.
Here, we’re not just talking about reaching the previous high. We’re watching to see whether price can break above it and hold there, opening the door to making a new high above the last one.
That’s the difference between a temporary rebound and a genuine shift in the market’s direction.
🔴 Second: The bearish scenario... Where does the picture change?
The bearish scenario is also clear and doesn’t require dozens of possibilities.
It starts with losing $64,630.
Breaking below this zone with consecutive closes, without buying momentum strong enough to reclaim it, would mean we’ve begun to lose the pivot point on which we based the bullish scenario.
Next, we move to:
$62,500.
A close below this level means breaking the 60 low structurally, in our reading, even before the price breakdown is complete.
Then we reach the most sensitive zone:
$59,005.
Breaking below it, even with a candle wick, means breaking the 57 low. At that point, we set aside the idea of a near-term rebound and start watching the next potential bottom zones.
Where might the correction find support?
$54,320.
$52,640.
Either of these zones could mark a bottom and consolidation point for the current cycle, and might become a launchpad for a new bullish phase.
But let’s not jump to conclusions; we’ll wait to see how price and liquidity behave when they reach these zones.
And now... what should we take away from all these numbers?
I’m not trying to convince you that Bitcoin will rise, nor am I warning you of an inevitable drop.
I’m laying out a decision map for you:
Price tells us how far we’ve come.
Closes tell us whether the breakout or breakdown has been confirmed.
Structure tells us whether the trend has truly changed.
Volume reveals whether the move has enough strength to continue.
$64,630 is the starting point for this analysis, and what happens next will show us which of the two scenarios is beginning to take hold in the market.
So why rush to choose a direction when the chart hasn’t shown us all its cards yet?
The coffee’s gone cold, the cigarette’s finished... but the market still has plenty to say! 😂☕🚬
This is an educational technical analysis based on my own model and experience reading markets. It is not financial advice or a call to sell or buy. Do your own research, understand what you’re reading on the chart, and make your own decisions.
And God knows best.
Good luck, everyone.