
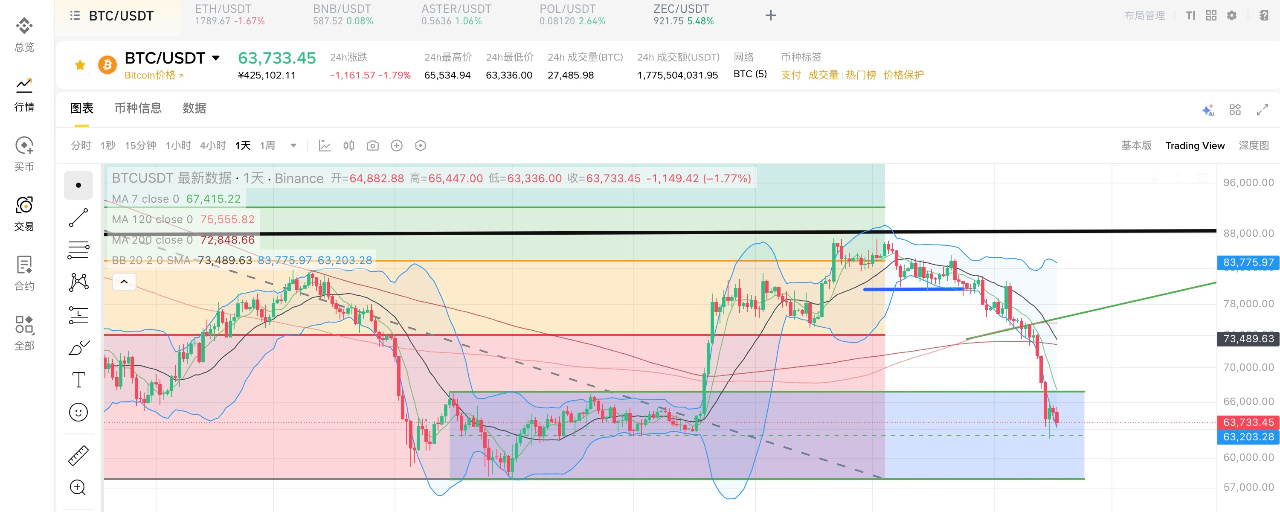

A turning point amid fear and pessimism? — Can #Bitcoin at 62,000 mark the bottom range of this correction?
Looking back at my view from last weekend: after #BTC fell to a low of 62,000 last week, it sparked concern in the market. Many people are already worried it could break below 62,000 again and even fall to around 50,000.
Indeed, lately there has been too much bad news, whether on the macro front or in U.S. stocks. Macro pressure is intense, and under such high-pressure conditions, any bearish sentiment gets amplified and spreads #英伟达财报夜!预期营收超千亿,AI股或迎大变盘
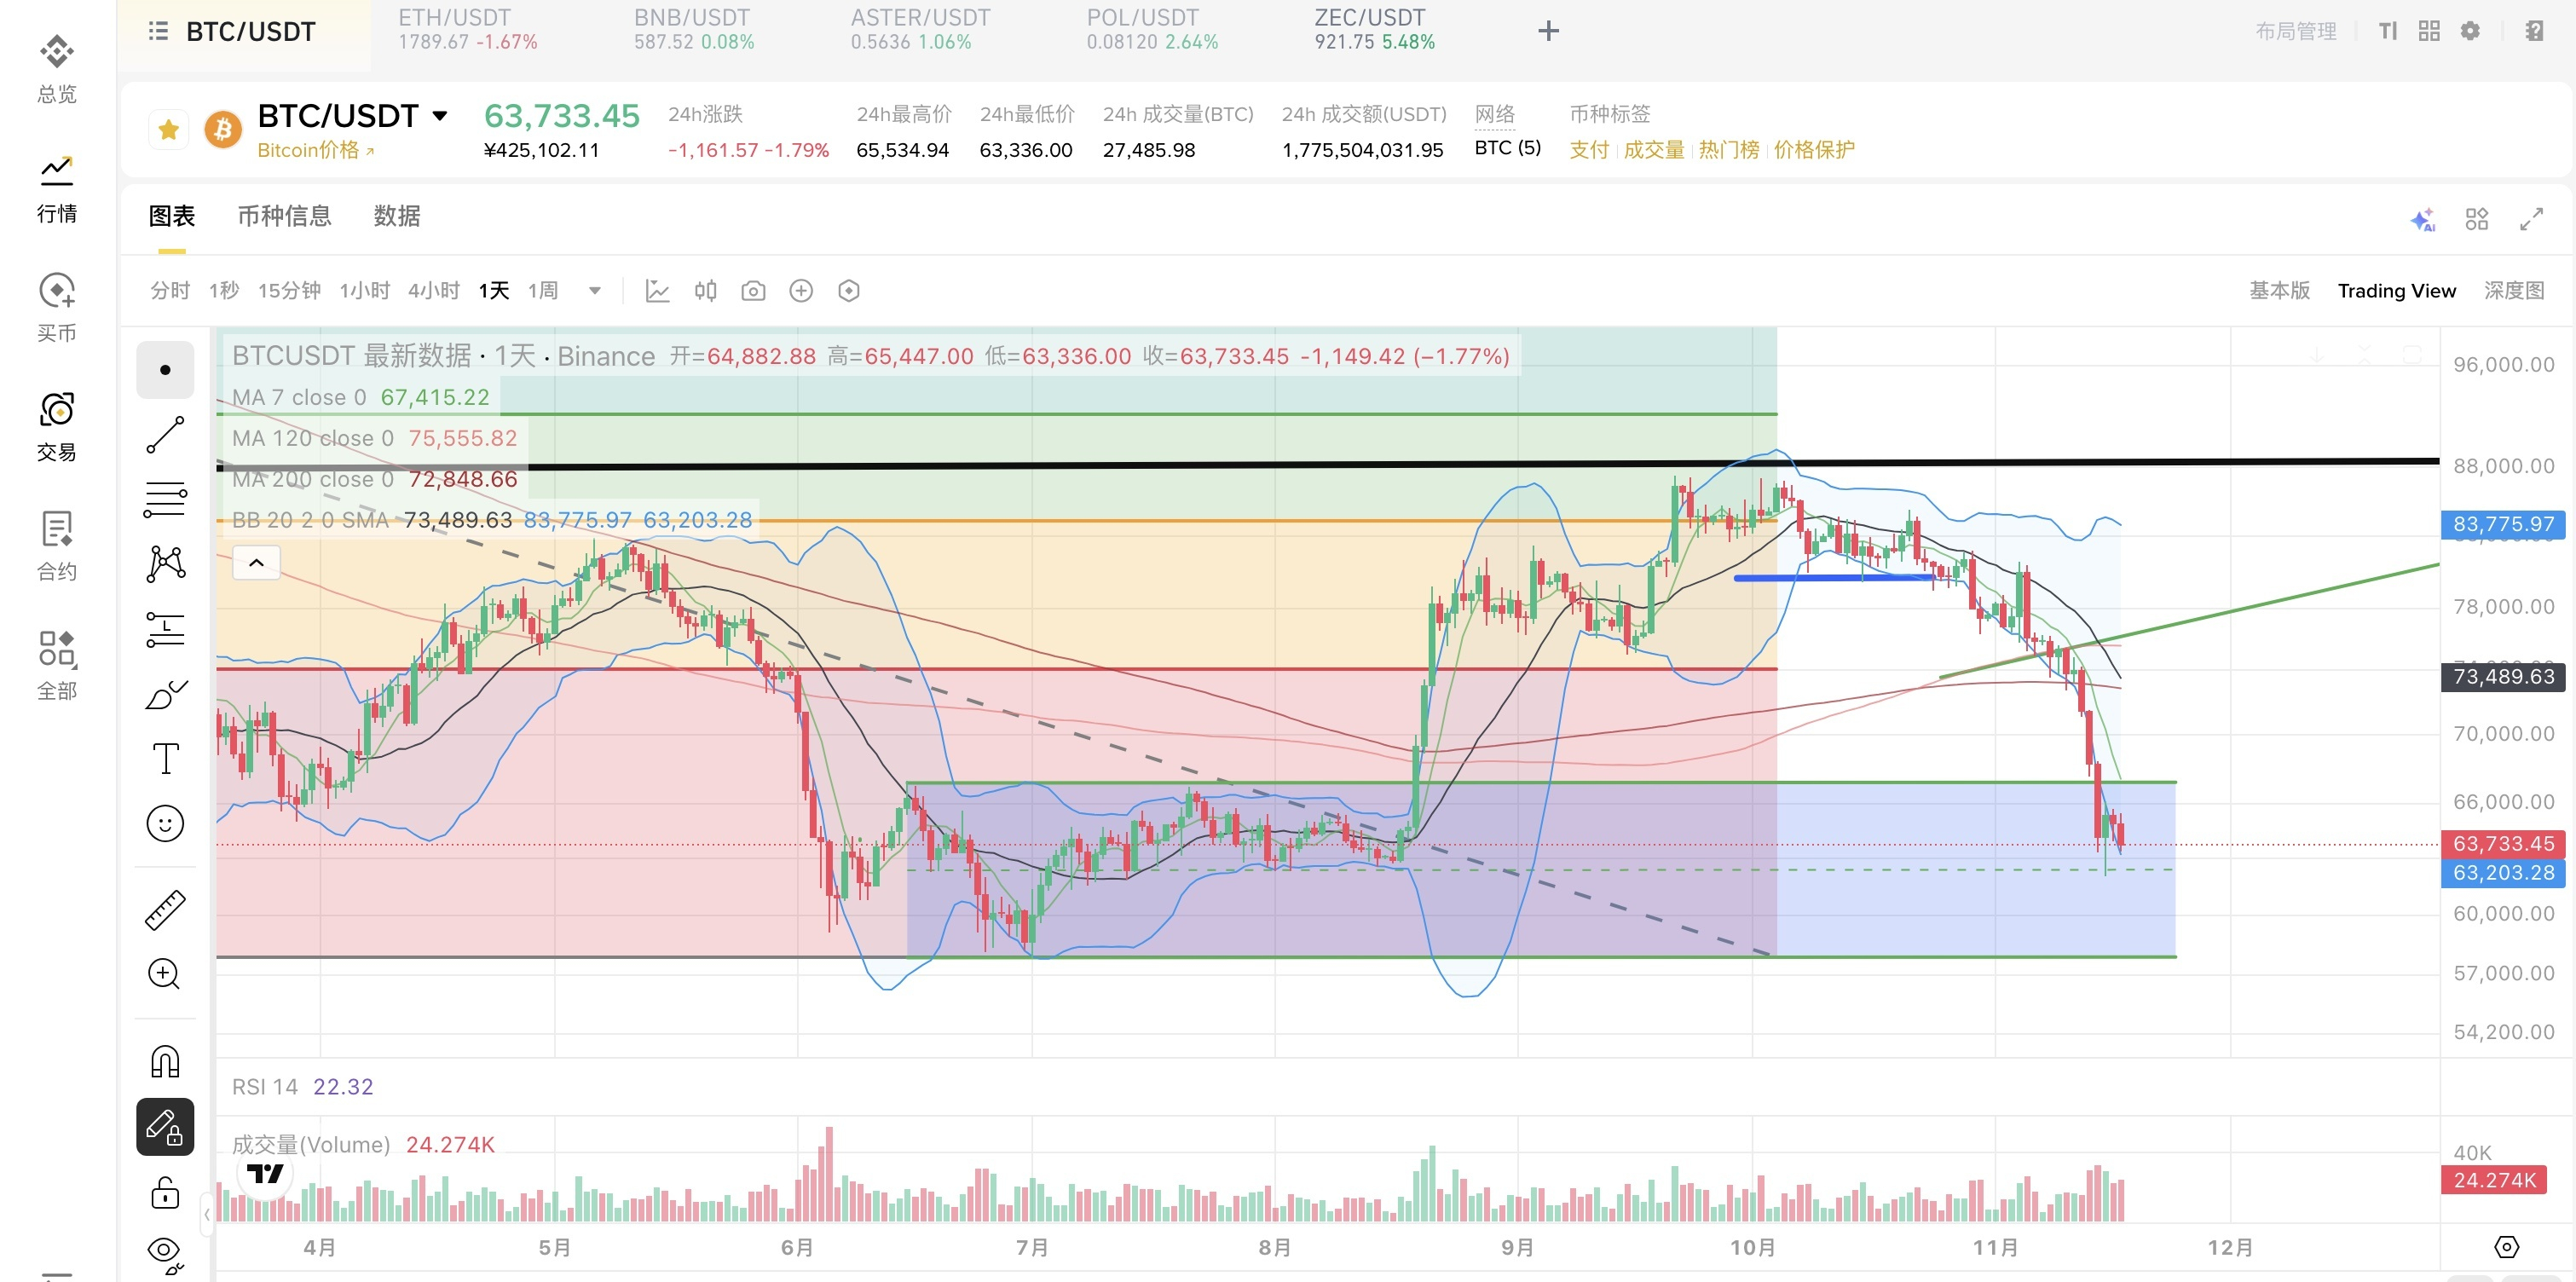
Can the drop to 62,000 this time mark the bottom of this correction? I think we first need to see technical signs that the decline has stopped and a rebound, then look at the data—ETF flows and whether crypto funds provide a second confirmation of the price move.
First, let’s look at the technical picture:
1. Confirmation of a short-term bottom on the hourly chart: After falling last week, the price rebounded noticeably on the hourly chart, then pulled back and moved sideways. It did not make a new low during this period. The decline stalled, leaving a long lower wick, followed by a rebound and sideways movement—a classic bottoming signal. Although the rebound has been weak, the hourly chart has already stabilized.
2. A bottom on the daily chart has not yet been confirmed. For now, it’s too early to tell. The plan at the end of last week was for the price to close above 78,000 before Wednesday, which would count as a valid rebound. After that, as long as the pullback did not break below the previous low, the bottom would be considered confirmed. But so far, the rebound has clearly been weak: the price has not climbed back above 78,000 and has continued to weaken. Although it has not yet made a new low in the short term, a bottom on the daily chart cannot be confirmed, so for now we should watch how the price moves sideways. If it breaks below the previous low, all bottoming signals will be invalidated.
3. The most optimistic expectation is that if the price can hold within its current trading range this week without making a new low, it will have stabilized in the short term. But whether we can confirm a bottom and a base signal will depend on when the price gets back above 78,000 and completes a technical recovery.
Now, let’s look at the data:
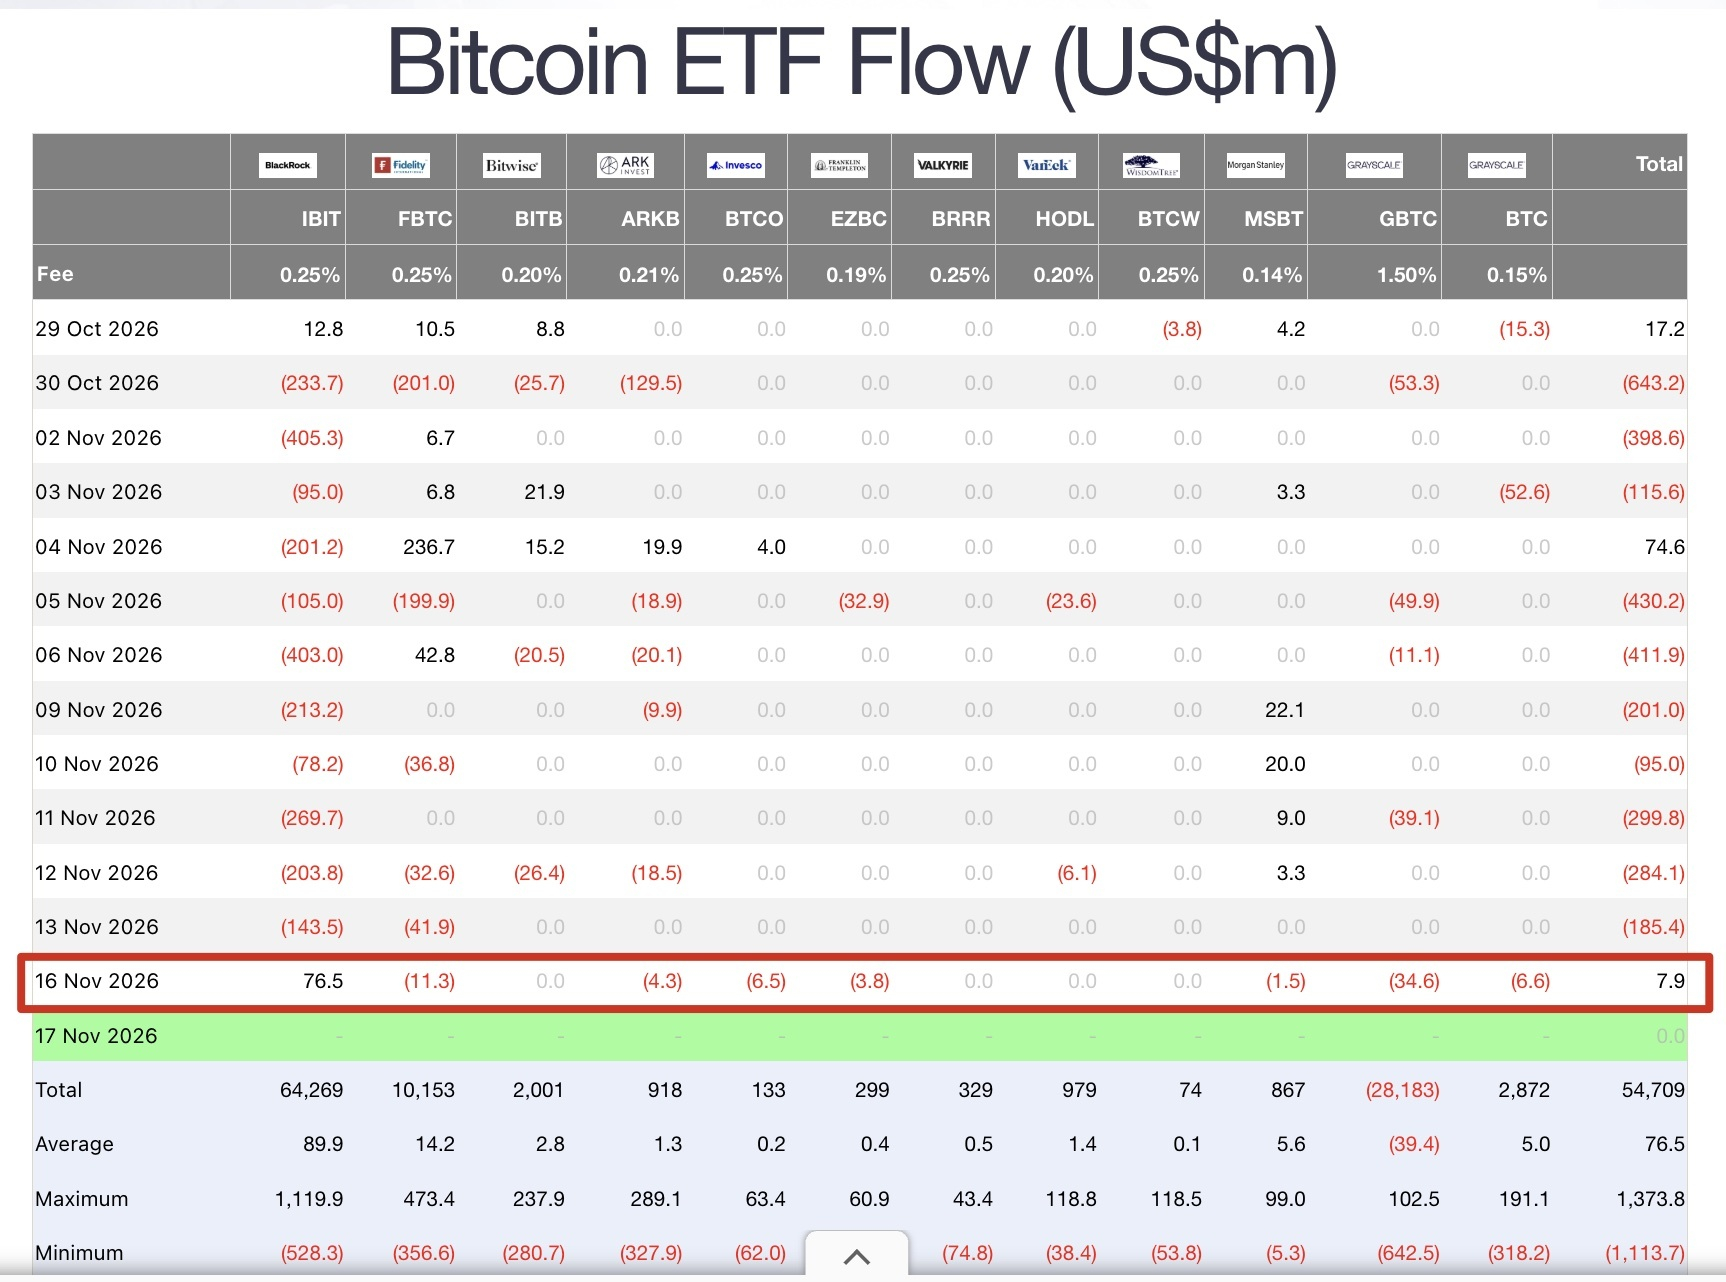
Monday’s ETF data is in. The drop at the end of last week did not make institutional investors pessimistic. In fact, the new price low prompted them to start buying, which is a good sign.
ETF data shows net inflows of 7.9 million on Monday. Although the inflow was modest, IBIT shifted from net outflows to net inflows, with 76.5 million in net inflows, making it the main source of buying on Monday. Other institutions continued to sell small amounts.
This creates a very interesting pattern: IBIT had been selling steadily in the previous price range, but when the price fell below its recent low, IBIT instead made large purchases. Clearly, IBIT’s institutional investors remain confident about the future and have chosen to buy the dip.
Now that ETF flows have turned positive, it will be very important to monitor this week’s data.
First, we need to see whether ETF net inflows broaden from IBIT alone to include all institutions.
Second, we need to see whether daily net inflows continue to grow and whether market confidence returns.
Finally, we need to see whether net inflows can be sustained, especially IBIT’s purchases. If inflows last only a few days, this may simply be short-term dip-buying by institutional investors. But if they continue buying through next week and beyond, it would mean institutional confidence is returning.
This doesn’t mean with 100% certainty that BTC’s price will rise immediately, but at least it would make the outlook for BTC’s trend more optimistic.
Crypto market data:
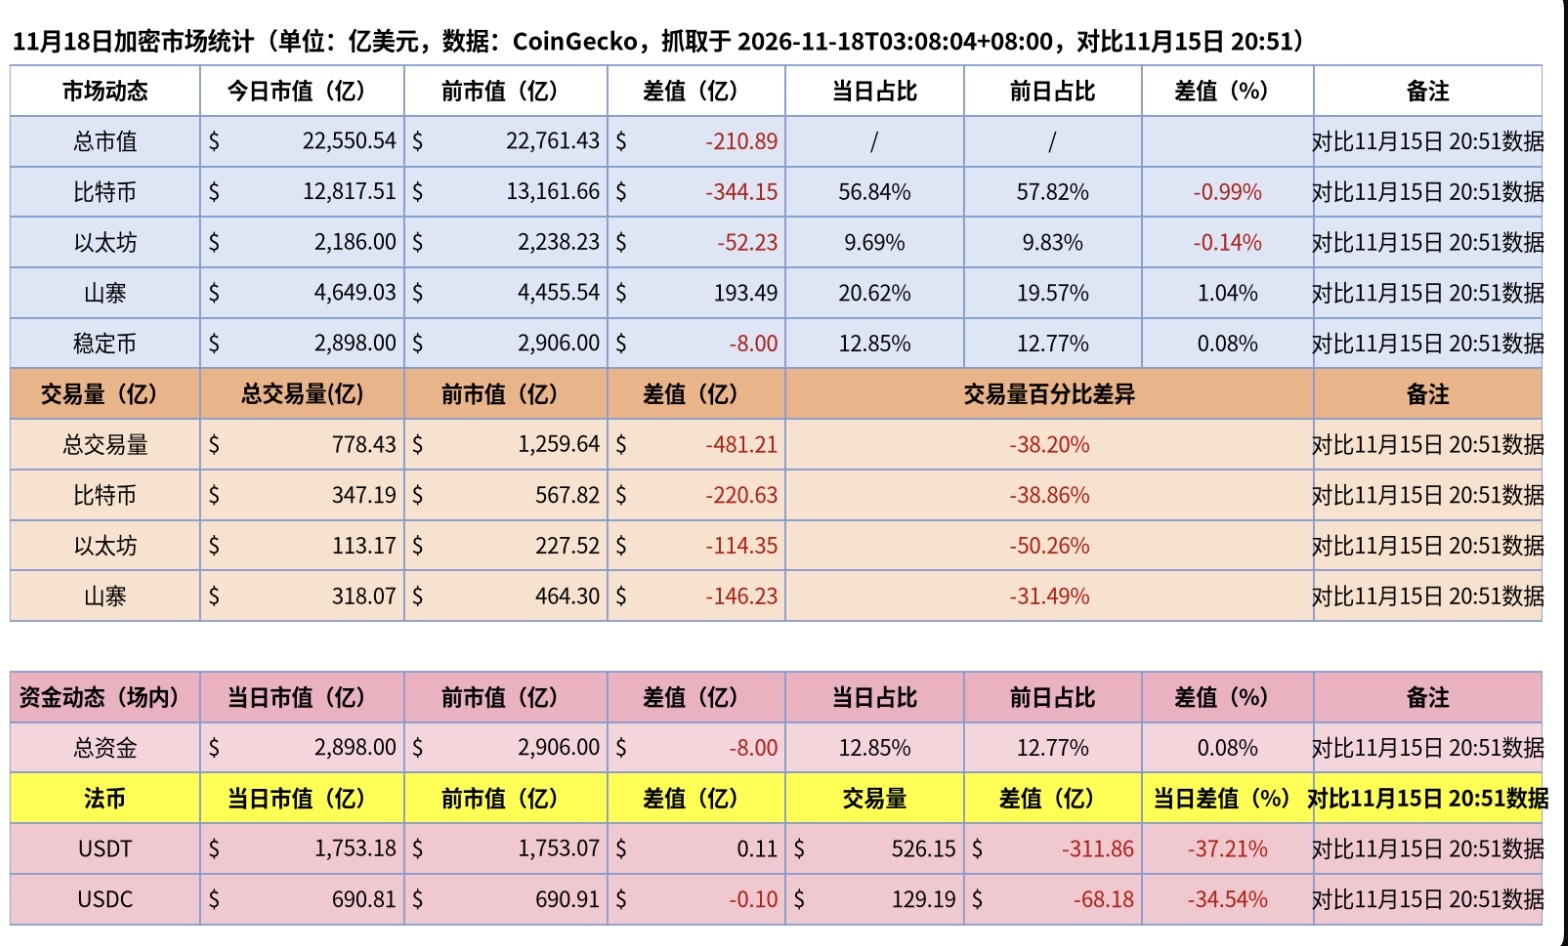
Compared with the data from the end of last week, crypto market data is still rather discouraging: market capitalization and trading volume have both fallen, while crypto assets continue to see substantial net outflows.
The good news is that net outflows from the major stablecoins USDT and USDC have paused. The current net outflows are not coming from major stablecoins, so their impact on BTC is gradually diminishing.
Interim summary:
We cannot be 100% certain that 62,000 was the bottom of this correction. But the rebound from 62,000 has shown me encouraging turning points in both the technical picture and the data.
Technically, the market is stabilizing and trading sideways. In the data, institutional investors are returning to ETFs as buyers, and IBIT is no longer a seller. In the crypto market, net outflows from major stablecoins have paused. These may all be signs of a market turning point.
If the market continues to stabilize without making a new low, ETF and crypto flows continue to return, and BTC gradually moves back above 68,000 while trading sideways, then it would truly mean that 62,000 was a short-term bottom this time!