I was planning to get to bed early tonight, but after showering and lying down, I couldn't resist checking my phone. Then I looked at the charts and—sigh—there went my sleep. I get a little tired watching the market myself, too.
Honestly, $BTC is hovering around 63723 right now, down 1.75% today and grinding between 63300 and 65500. It’s fallen 15.40% in 7 days and 21.77% in 30 days. This kind of slow bleed is the most exhausting—not a sharp crash, just a gradual grind lower.
That said, technically, the daily RSI(6) is only 15.65, and both the 1-hour and 4-hour charts are oversold too. I’ve seen this kind of setup many times before, and it often leads to a decent spot-market recovery. But let’s be clear: price is still below all the moving averages. Large funds saw net inflows of 6061 in a day, but that’s not enough to call a reversal just yet. For now, I’m treating this as a swing-trading opportunity within a broader downtrend.
There’s another confusing factor: 75.30% of all accounts are long, and among large traders that figure is even higher at 77.81%. The funding rate is still +0.0036%, so longs are still paying. Everyone’s crowded on one side, and if the market dips again from here, a lot of people may not be able to hold on. So be especially careful around the lower levels.
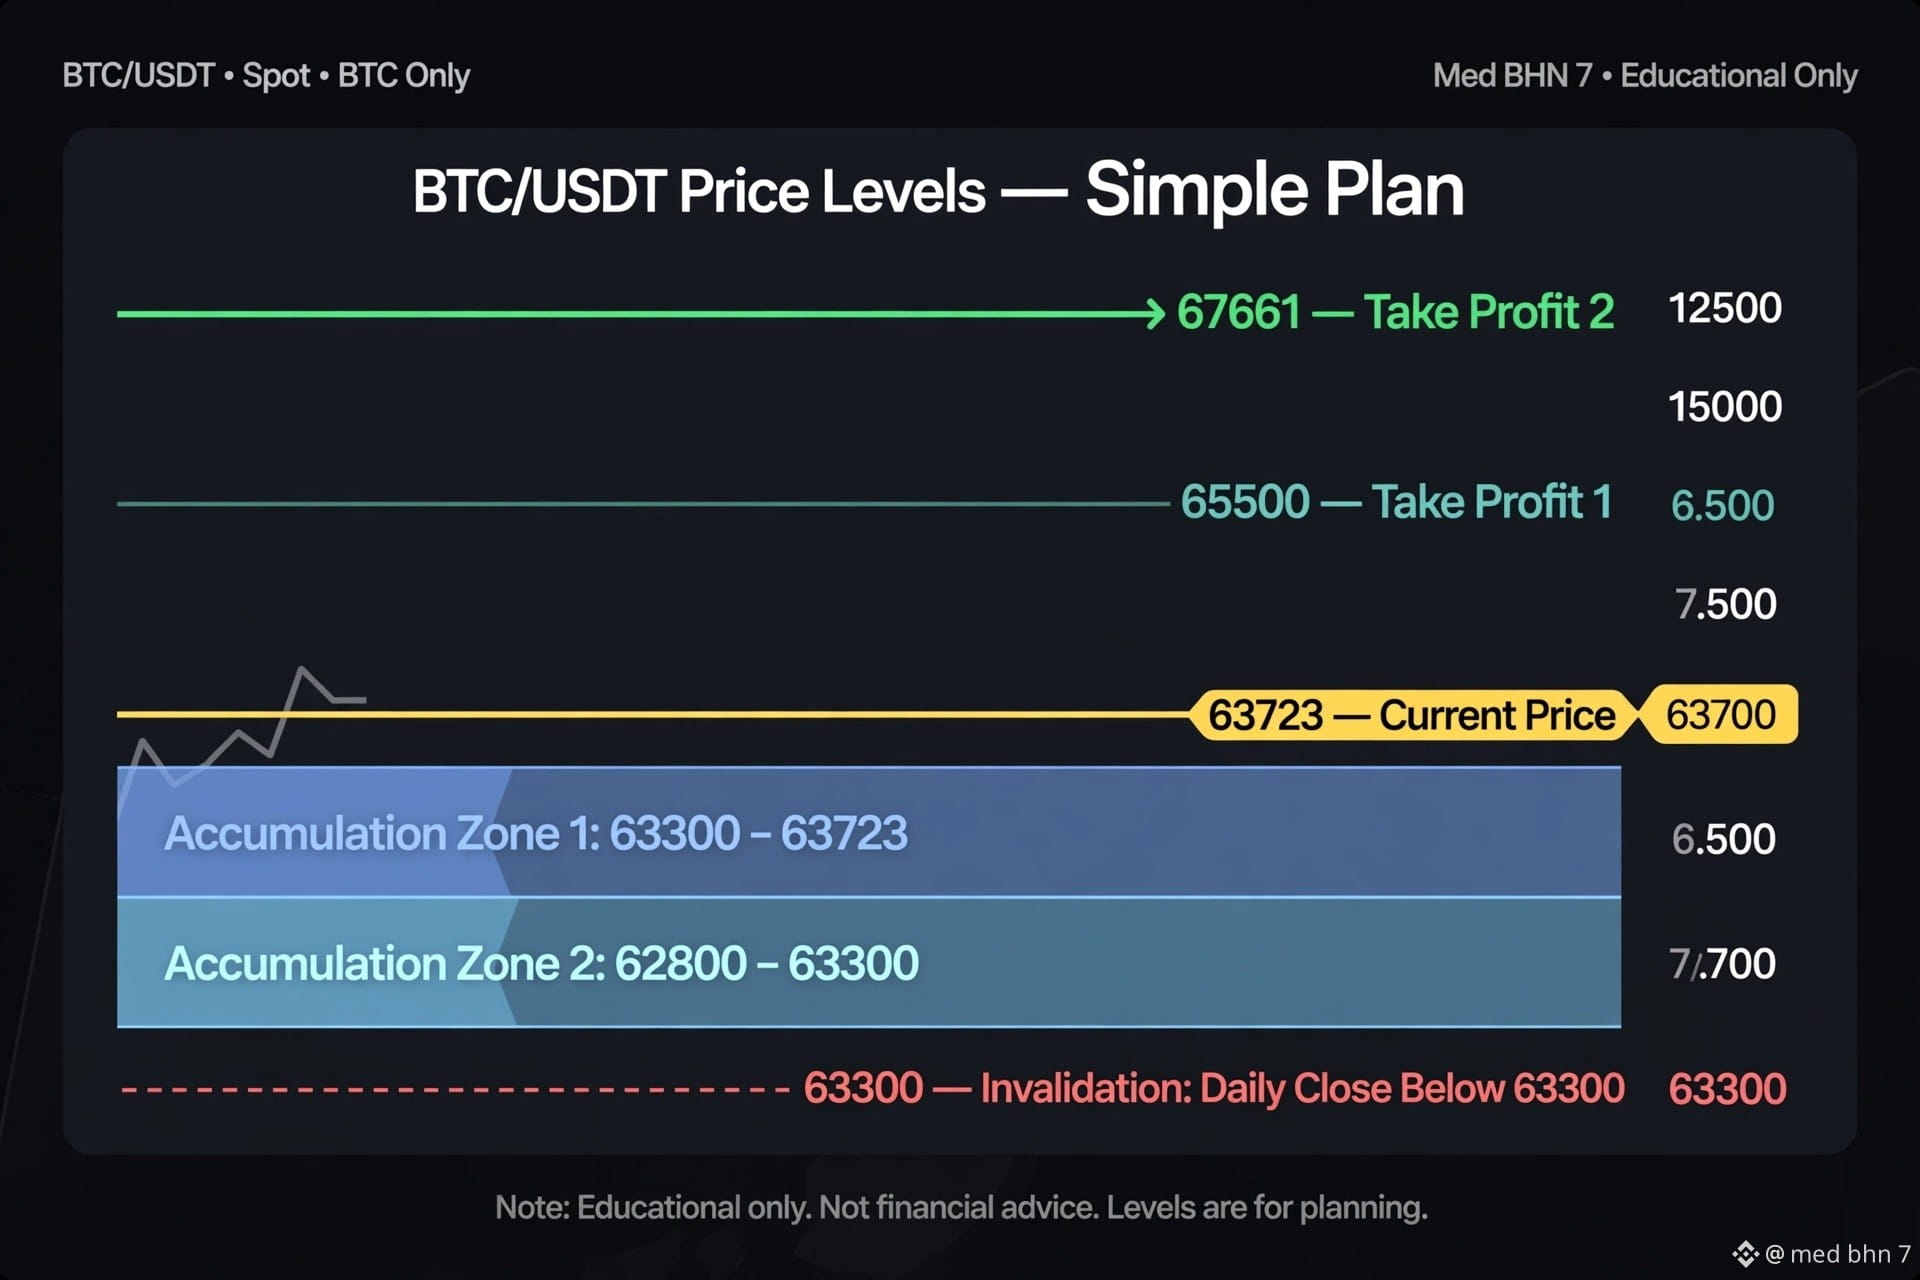
For spot trading, keep an eye on 63300–63723 as the first accumulation zone. If there’s a liquidity sweep with a long wick, the second buy zone is 62800–63300. The initial technical target for a rebound is 65500, followed by 67661. If the daily candle closes below 63300, the bullish outlook is off the table.
Overall, placing staggered limit orders is safer than blindly chasing the price. Have you started buying in batches today, or are you waiting for confirmation?
—MedBHN7
#BTC #SpotTrading
Honestly, $BTC is hovering around 63723 right now, down 1.75% today and grinding between 63300 and 65500. It’s fallen 15.40% in 7 days and 21.77% in 30 days. This kind of slow bleed is the most exhausting—not a sharp crash, just a gradual grind lower.
That said, technically, the daily RSI(6) is only 15.65, and both the 1-hour and 4-hour charts are oversold too. I’ve seen this kind of setup many times before, and it often leads to a decent spot-market recovery. But let’s be clear: price is still below all the moving averages. Large funds saw net inflows of 6061 in a day, but that’s not enough to call a reversal just yet. For now, I’m treating this as a swing-trading opportunity within a broader downtrend.
There’s another confusing factor: 75.30% of all accounts are long, and among large traders that figure is even higher at 77.81%. The funding rate is still +0.0036%, so longs are still paying. Everyone’s crowded on one side, and if the market dips again from here, a lot of people may not be able to hold on. So be especially careful around the lower levels.
For spot trading, keep an eye on 63300–63723 as the first accumulation zone. If there’s a liquidity sweep with a long wick, the second buy zone is 62800–63300. The initial technical target for a rebound is 65500, followed by 67661. If the daily candle closes below 63300, the bullish outlook is off the table.
Overall, placing staggered limit orders is safer than blindly chasing the price. Have you started buying in batches today, or are you waiting for confirmation?
—MedBHN7
#BTC #SpotTrading