
🚨 We’re analyzing the live chart for $ONE /USDT (5-minute time frame) to spot 📊 Real-Time Technical Analysis
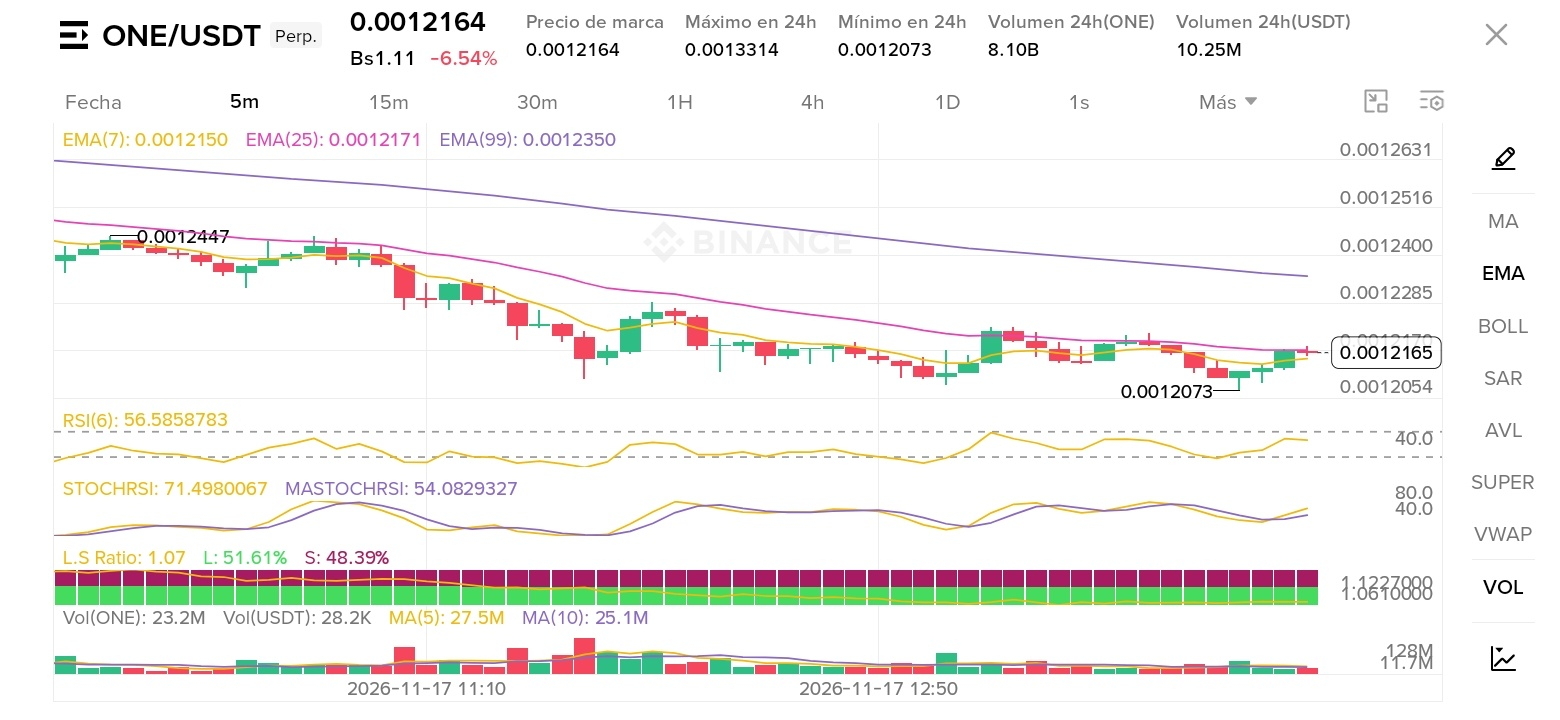
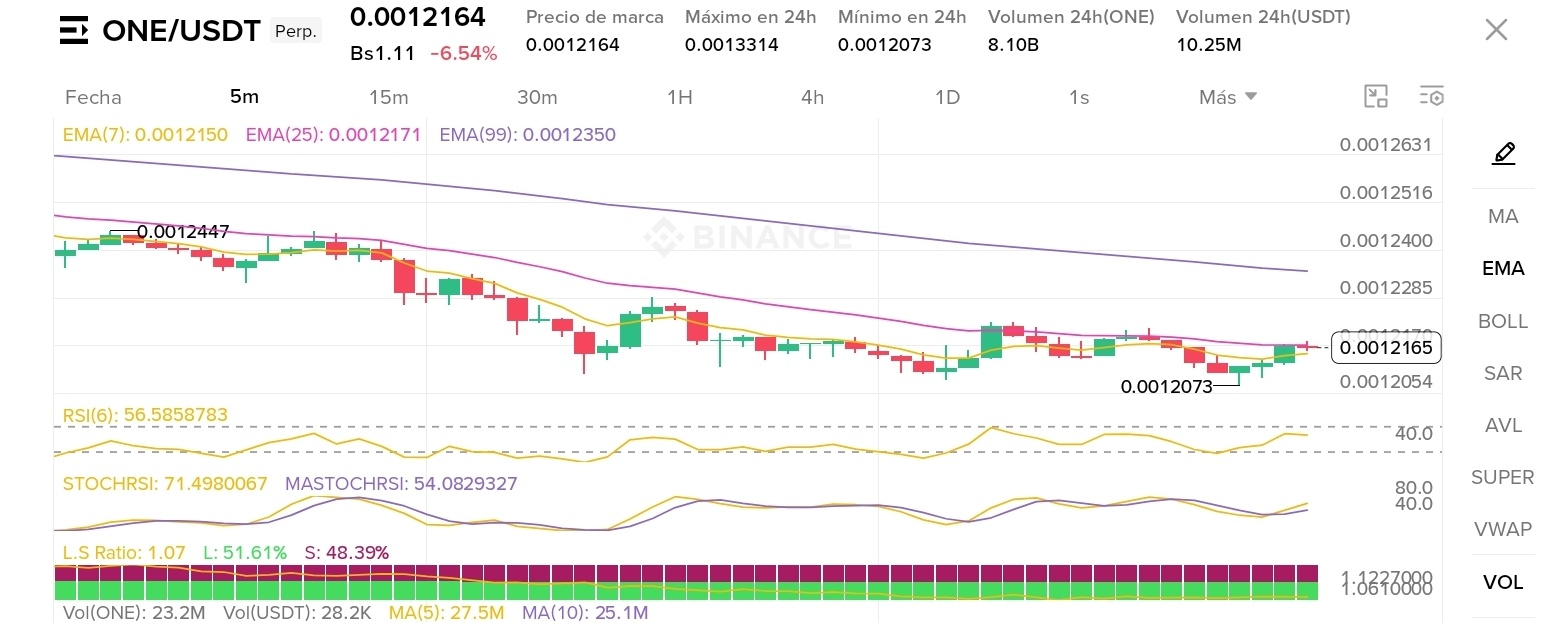
Current Price: 0.0012164 USDT (down -6.54% on the daily chart).
EMA Ribbon (Exponential Moving Averages):
EMA(7): 0.0012150
EMA(25): 0.0012171
EMA(99): 0.0012350
Reading: The price is compressed just below the EMA(7) and EMA(25), attempting to consolidate a floor after a corrective phase, while the EMA(99) acts as major overhead resistance on this time frame.
RSI(6): At 56.58, showing a neutral-to-bullish short-term bias, emerging from compression zones with room to test higher levels if buying volume comes in.
StochRSI: %K at 71.49 and %D at 54.08, crossing upward. This reflects nascent buying momentum looking to test nearby resistance zones.
Long/Short Ratio: 1.07 (Longs: 51.61% / Shorts: 48.39%), indicating a fairly contested market, but with a slight buying edge as traders bet on a technical bounce.
🚀 Post Ready for Binance Square
(Copy, paste, and customize this post for your profile)
🔥 #ONE /USDT: Preparing for a bounce or a scalping bear trap? 📈👀
Price action on the 5m chart shows ONE trading around 0.0012164 USDT, looking to stabilize after touching lows of 0.0012073.
Key indicators are showing interesting signals to keep a close eye on: 👉 RSI(6) at ~56.5 is regaining traction, and the StochRSI is crossing upward from the middle zone, suggesting coiled short-term pressure. 👉 The Long/Short Ratio stands at 1.07, with bulls taking a slight lead (51.6%) over bears.
⚠️ Key zone to watch: If it breaks through the confluence of the EMA(7) and EMA(25) with volume, we could see a quick push toward higher resistance levels. Strict risk management—and let's catch those pips! ⚡️
How do you see ONE performing over the next few hours? Buying the dip or waiting for confirmation? Let me know in the comments! 👇💬