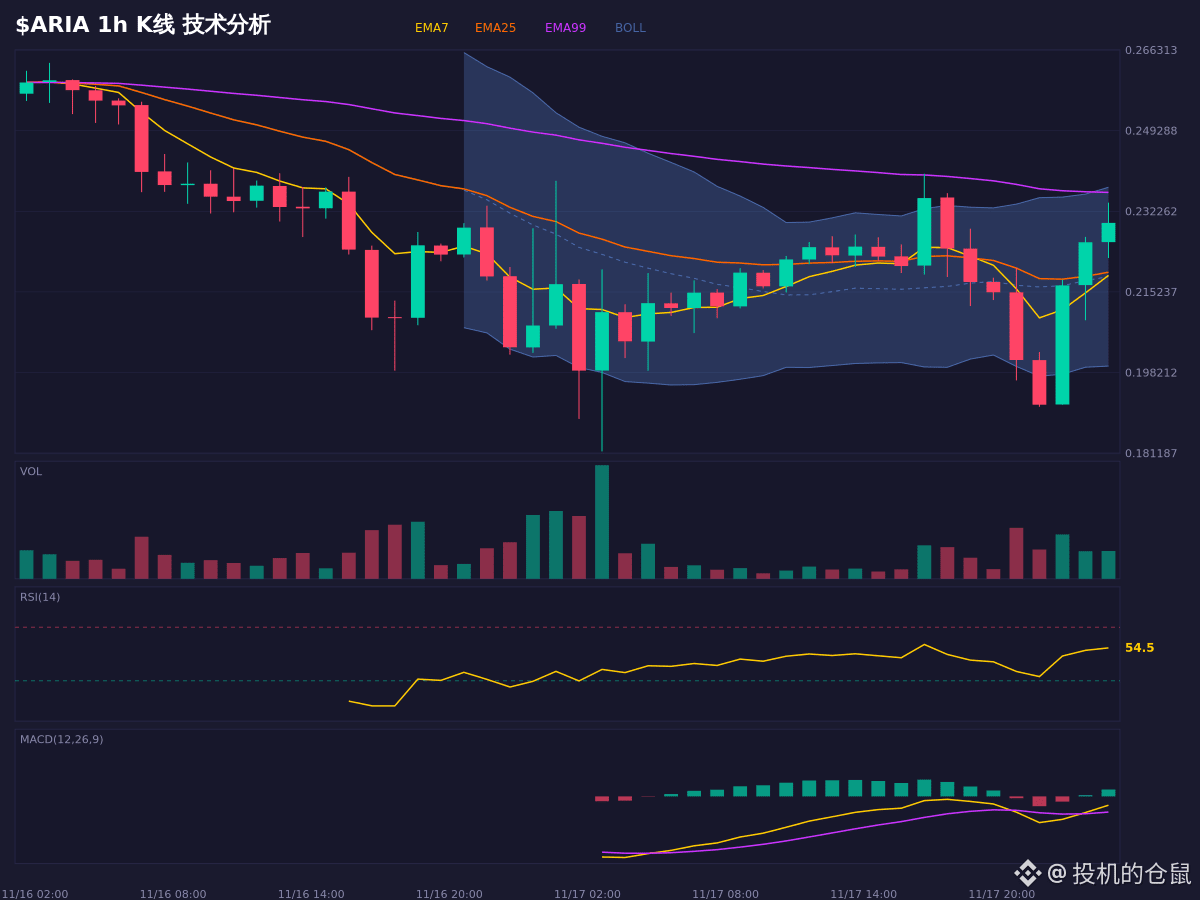
$ARIA This price action is quite interesting. The moving averages are in a bearish alignment, but RSI and MACD both indicate bullish momentum—the bulls and bears are battling it out. The Stoch RSI K line has crossed below the D line, signaling a short-term pullback risk. But RSI is only a little above 54, not overbought, so the pullback may just be consolidation. OBV shows outflows, while the funding rate is leaning bullish—a bit contradictory.
The key is the support zone between 0.210875 and 0.217796. If it holds, the price could continue climbing. Resistance is at 0.239720; if the price can't break through around 0.240200, a pullback is likely.
If it falls below 0.197110, the current bullish outlook will need to be reconsidered.
For chart observation and conditional analysis only; this is not a record of trading activity.
$ARIA #熊市 #永续合约 #Market Sentiment
The key is the support zone between 0.210875 and 0.217796. If it holds, the price could continue climbing. Resistance is at 0.239720; if the price can't break through around 0.240200, a pullback is likely.
If it falls below 0.197110, the current bullish outlook will need to be reconsidered.
For chart observation and conditional analysis only; this is not a record of trading activity.
$ARIA #熊市 #永续合约 #Market Sentiment