$BTC Crypto Academician: 11.18 Bitcoin (BTC) Daily Chart Bearish, Four-Hour Weak Rebound: Behind the Divergence Between Longer and Shorter Timeframes, How Is Capital Positioning Itself?
Market volatility is normal; rises and falls never last forever. The most common mistake beginners make is trading based on their emotions: panicking when prices drop and getting excited when they rise. First, work out how much you can afford to lose, keep your position size small, and leave yourself some room to maneuver. It is safer to stay out of a market you don’t understand than to force yourself into a trade. When reviewing your trades, focus on price levels and rules, not stories of overnight riches from other people. Take it slowly: first learn how to avoid major losses, then think about how to make money.
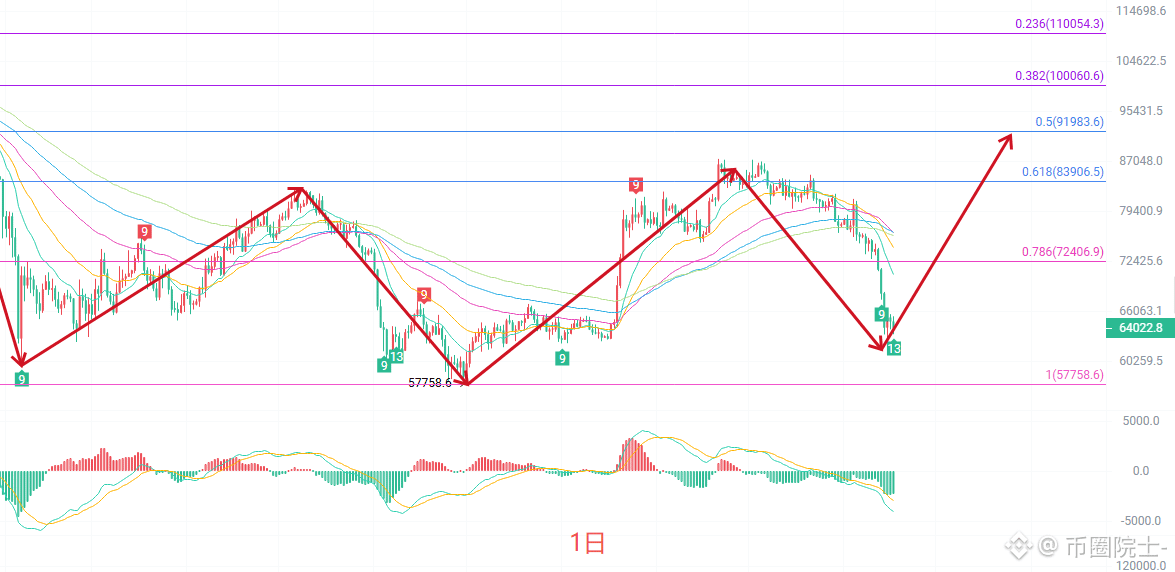
On the daily chart, consecutive bearish candles have formed. The price dipped to around 61956 before recovering slightly and is now consolidating near 65000. It has fallen below the short- and medium-term EMA cluster, with the 15-day, 30-day, and 60-day moving averages all aligned bearishly and pointing down. Overall, the daily chart remains in a downtrend. The MACD lines are below the zero line and opening downward, while the green histogram bars continue to grow, indicating that medium-term selling pressure has not yet fully eased. The price has touched the lower Bollinger Band, and the bands are expanding downward, so the short-term bearish trend remains dominant. There is currently no clear bottoming or reversal signal on the daily timeframe. This can only be viewed as a weak rebound following a sharp drop, and the price could fall again after rebounding into the moving-average resistance zone.
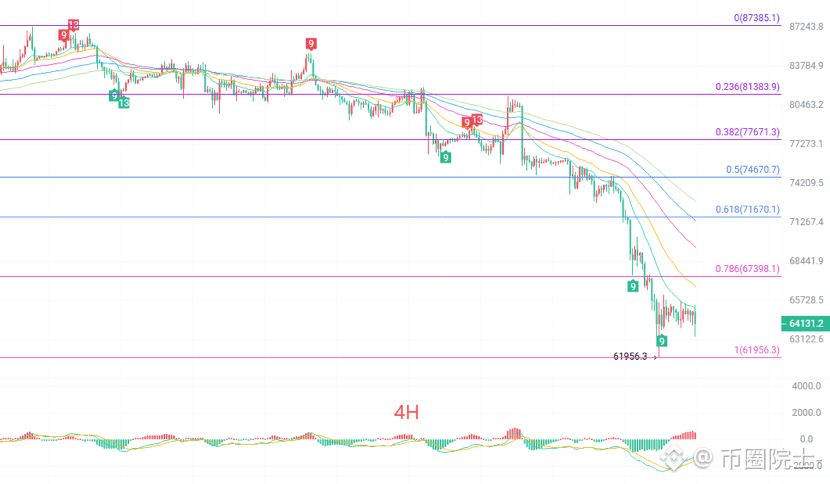
On the four-hour chart, the price recovered slightly after bottoming at 61956, forming several small bullish candles and moving sideways. It is currently trading around the 64900–65400 range. The short-term EMA15 and EMA30 are still acting as resistance above the price, while EMA70, EMA90, and EMA120 are all diverging downward. The bearish structure of the short- and medium-term moving averages remains unchanged. The four-hour MACD has turned up slightly from a low level, and the red histogram bars are starting to expand, indicating some potential for a weak short-term rebound. However, the MACD lines remain below the zero line, so this rebound is an oversold correction rather than a trend reversal. The lower Bollinger Band has flattened after moving down, and the price is trading below the middle band. The first short-term resistance zone is 66700–67000, while 63600–62000 is a key support range. Treat the market as range-bound until the price breaks out of this box.
Short-term reference:
Short (sell): if the price rises to 67200–67700 and stalls, stop loss at 500 points, targets 66000–65000.
Long (buy): if the price falls to 64000–63500 and finds support, stop loss at 500 points, targets 65000–86500.
Actual trading decisions should be based on real-time order book data. For more information, contact the author. Articles may be published with a delay. This is for reference only; trade at your own risk.
#BTC走势分析
Market volatility is normal; rises and falls never last forever. The most common mistake beginners make is trading based on their emotions: panicking when prices drop and getting excited when they rise. First, work out how much you can afford to lose, keep your position size small, and leave yourself some room to maneuver. It is safer to stay out of a market you don’t understand than to force yourself into a trade. When reviewing your trades, focus on price levels and rules, not stories of overnight riches from other people. Take it slowly: first learn how to avoid major losses, then think about how to make money.
On the daily chart, consecutive bearish candles have formed. The price dipped to around 61956 before recovering slightly and is now consolidating near 65000. It has fallen below the short- and medium-term EMA cluster, with the 15-day, 30-day, and 60-day moving averages all aligned bearishly and pointing down. Overall, the daily chart remains in a downtrend. The MACD lines are below the zero line and opening downward, while the green histogram bars continue to grow, indicating that medium-term selling pressure has not yet fully eased. The price has touched the lower Bollinger Band, and the bands are expanding downward, so the short-term bearish trend remains dominant. There is currently no clear bottoming or reversal signal on the daily timeframe. This can only be viewed as a weak rebound following a sharp drop, and the price could fall again after rebounding into the moving-average resistance zone.
On the four-hour chart, the price recovered slightly after bottoming at 61956, forming several small bullish candles and moving sideways. It is currently trading around the 64900–65400 range. The short-term EMA15 and EMA30 are still acting as resistance above the price, while EMA70, EMA90, and EMA120 are all diverging downward. The bearish structure of the short- and medium-term moving averages remains unchanged. The four-hour MACD has turned up slightly from a low level, and the red histogram bars are starting to expand, indicating some potential for a weak short-term rebound. However, the MACD lines remain below the zero line, so this rebound is an oversold correction rather than a trend reversal. The lower Bollinger Band has flattened after moving down, and the price is trading below the middle band. The first short-term resistance zone is 66700–67000, while 63600–62000 is a key support range. Treat the market as range-bound until the price breaks out of this box.
Short-term reference:
Short (sell): if the price rises to 67200–67700 and stalls, stop loss at 500 points, targets 66000–65000.
Long (buy): if the price falls to 64000–63500 and finds support, stop loss at 500 points, targets 65000–86500.
Actual trading decisions should be based on real-time order book data. For more information, contact the author. Articles may be published with a delay. This is for reference only; trade at your own risk.
#BTC走势分析