$ETH Crypto Academician: Nov. 18 Ethereum (ETH)—Is a rebound imminent, or is this a dead-cat bounce trap? Is the golden cross below the zero line worth trusting?
A few notes from the review: First, with the daily chart in a bearish trend, golden crosses and rebounds on the four-hour chart should be viewed with caution; a rebound does not mean a reversal. Second, prices near the lower Bollinger Band may see a technical bounce, or they may continue moving down along the lower band; the channel position alone does not indicate direction. Third, a high TD count is a reminder to watch for momentum exhaustion, not a guarantee that a bottom is in. A trading plan should first lay out both bullish and bearish scenarios with their corresponding stop-losses, then wait for price to reach confirmation levels.
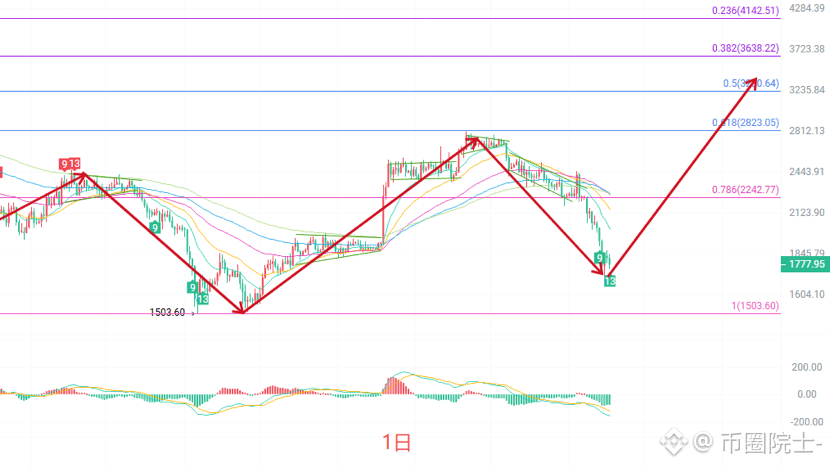
On the daily candlestick chart, the price is below all five moving averages, and the medium- and long-term averages are clearly bearishly aligned. Any rebound will encounter resistance from these averages in succession. The MACD lines are below the zero line, and the histogram is still printing green bars, indicating that bearish momentum on the daily chart has not fully run its course. The Bollinger Bands are at 2111 (middle), 2485 (upper), and 1737 (lower), with the price now near the lower band. The TD count has reached 13. The short-term decline has continued, but this is also a level where we should watch for signs of oversold momentum exhaustion. Overall daily assessment: the weak downtrend remains intact; a single bearish candle is not enough to conclude that a bottom is in.
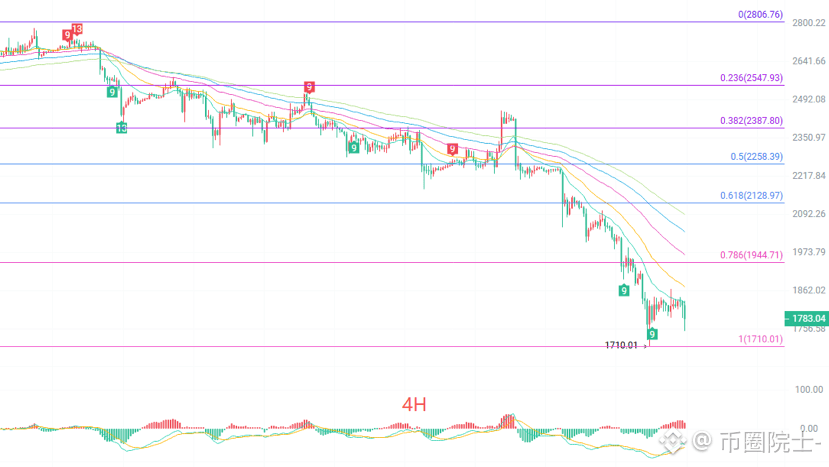
On the four-hour chart, the price is also below all short- and medium-term moving averages. The nearest resistance overhead is around 1830, near the EMA15. One positive sign is that the MACD lines below the zero line appear to be converging and turning upward, with the first red bars emerging. This suggests the four-hour chart may be attempting a corrective rebound after becoming oversold, and the short-term rate of decline has slowed. The Bollinger Bands are at 1822 (middle), 1874 (upper), and 1769 (lower), with the price below the middle band. The previous low of 1710 is an important reference point for this pullback. Four-hour assessment: the broader direction remains weak, but there are early signs of the decline stabilizing and a rebound attempt taking shape. Whether the rebound can continue will depend largely on whether the price can reclaim 1830 and move toward 1874.
Short-term reference:
Short: if the price stalls between 1840 and 1880, stop-loss at 30 points; target 1800 to 1750.
Long: if the price finds support between 1770 and 1730, stop-loss at 30 points; target 1820 to 1860.
For specific trades, rely primarily on real-time order book data. For more information, feel free to contact the author. There may be a delay in publication; this is for reference only, and you assume all risk.
#ETH走势分析 #ETH(二饼)
A few notes from the review: First, with the daily chart in a bearish trend, golden crosses and rebounds on the four-hour chart should be viewed with caution; a rebound does not mean a reversal. Second, prices near the lower Bollinger Band may see a technical bounce, or they may continue moving down along the lower band; the channel position alone does not indicate direction. Third, a high TD count is a reminder to watch for momentum exhaustion, not a guarantee that a bottom is in. A trading plan should first lay out both bullish and bearish scenarios with their corresponding stop-losses, then wait for price to reach confirmation levels.
On the daily candlestick chart, the price is below all five moving averages, and the medium- and long-term averages are clearly bearishly aligned. Any rebound will encounter resistance from these averages in succession. The MACD lines are below the zero line, and the histogram is still printing green bars, indicating that bearish momentum on the daily chart has not fully run its course. The Bollinger Bands are at 2111 (middle), 2485 (upper), and 1737 (lower), with the price now near the lower band. The TD count has reached 13. The short-term decline has continued, but this is also a level where we should watch for signs of oversold momentum exhaustion. Overall daily assessment: the weak downtrend remains intact; a single bearish candle is not enough to conclude that a bottom is in.
On the four-hour chart, the price is also below all short- and medium-term moving averages. The nearest resistance overhead is around 1830, near the EMA15. One positive sign is that the MACD lines below the zero line appear to be converging and turning upward, with the first red bars emerging. This suggests the four-hour chart may be attempting a corrective rebound after becoming oversold, and the short-term rate of decline has slowed. The Bollinger Bands are at 1822 (middle), 1874 (upper), and 1769 (lower), with the price below the middle band. The previous low of 1710 is an important reference point for this pullback. Four-hour assessment: the broader direction remains weak, but there are early signs of the decline stabilizing and a rebound attempt taking shape. Whether the rebound can continue will depend largely on whether the price can reclaim 1830 and move toward 1874.
Short-term reference:
Short: if the price stalls between 1840 and 1880, stop-loss at 30 points; target 1800 to 1750.
Long: if the price finds support between 1770 and 1730, stop-loss at 30 points; target 1820 to 1860.
For specific trades, rely primarily on real-time order book data. For more information, feel free to contact the author. There may be a delay in publication; this is for reference only, and you assume all risk.
#ETH走势分析 #ETH(二饼)