
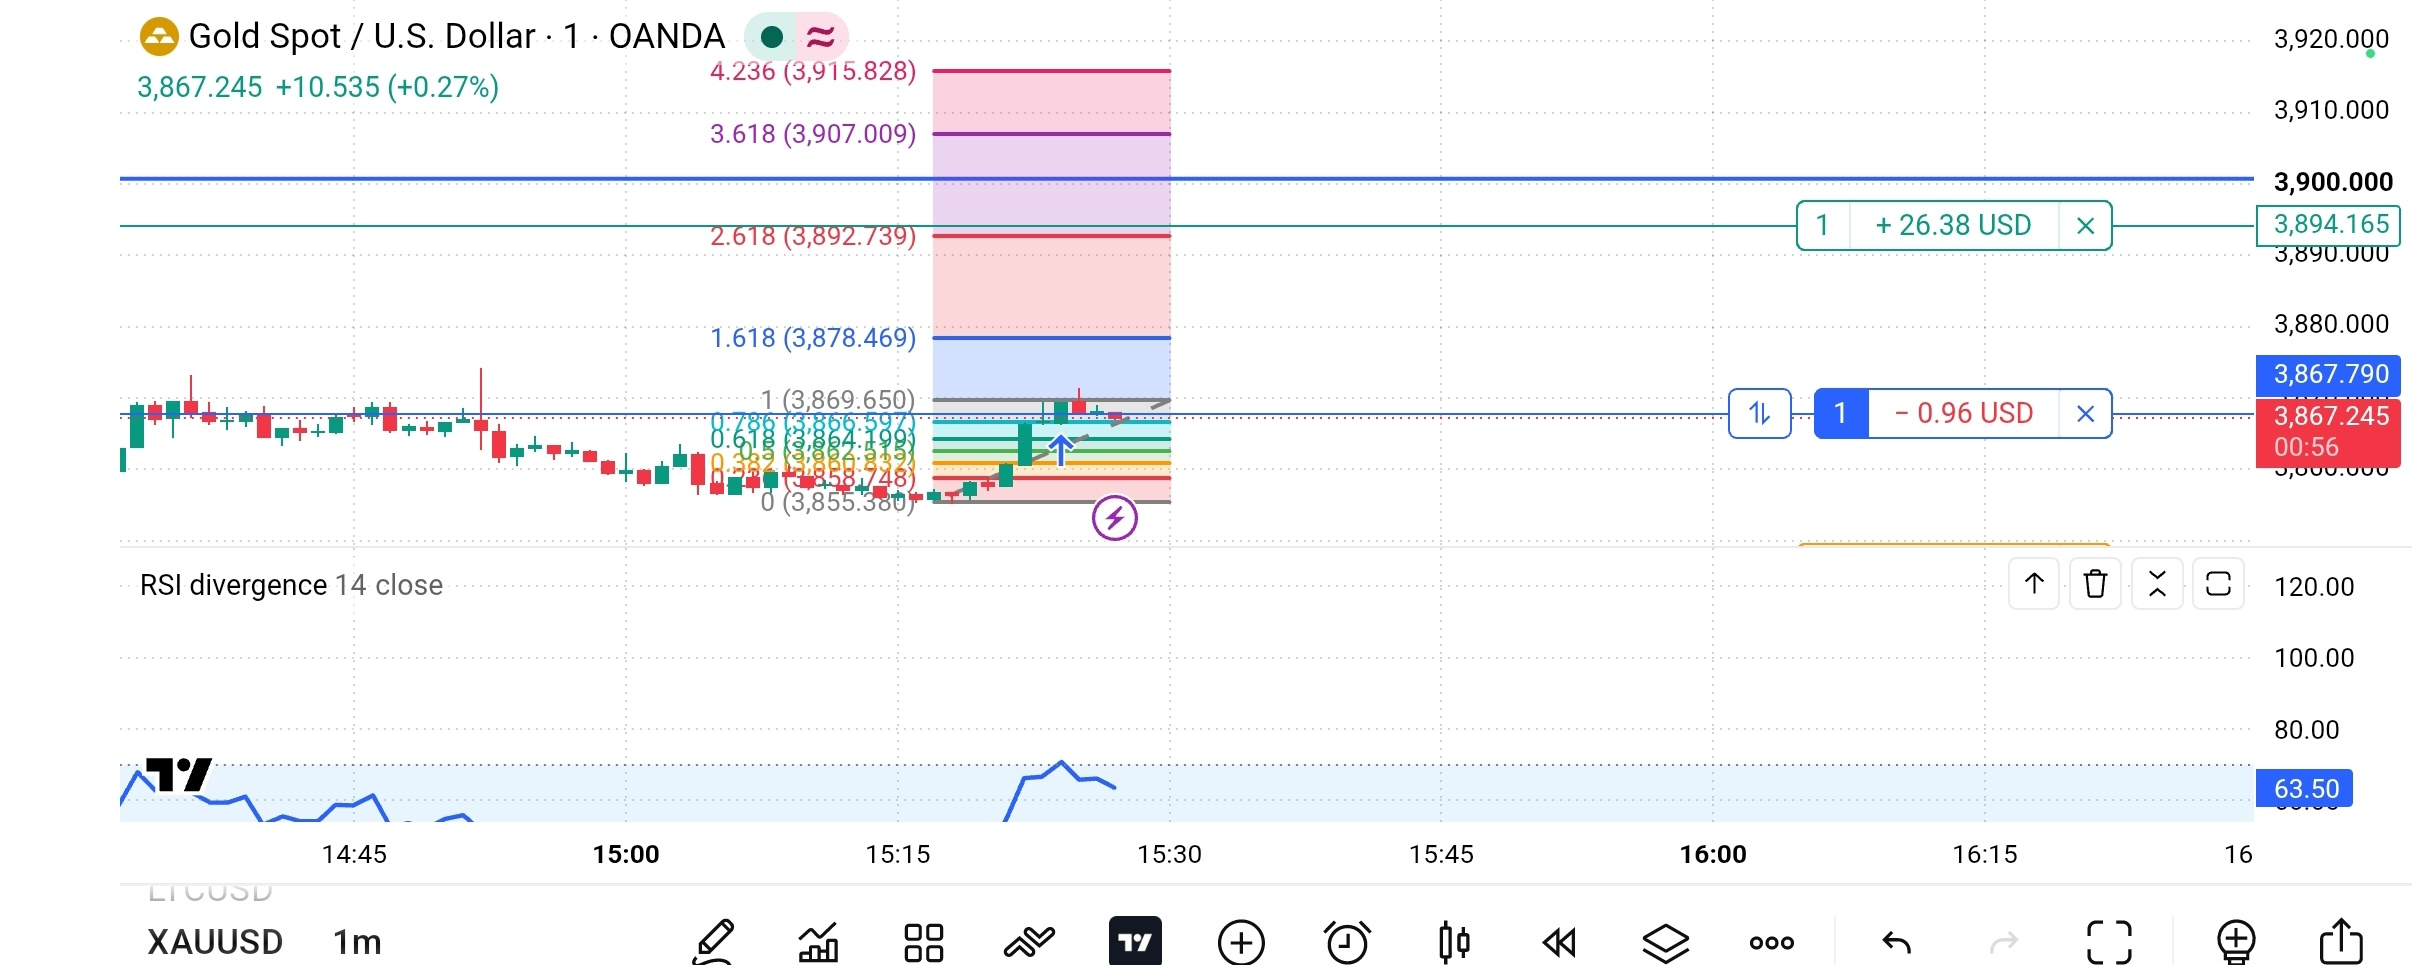

📊 Gold (XAUUSD) Market Analysis – Key Levels and Trading Outlook $XAU $BTC $ETH
Gold is showing an interesting price movement on the 1-minute chart. After a small downward move, the price recovered and started consolidating around the 3,867 level. This makes the next move important for short-term traders.
🔍 Key Levels to Watch
🟢 Support Zone: 3,855–3,860
This area may act as short-term support if selling pressure returns.
🔴 Resistance Zone: 3,878–3,892
Gold may face selling pressure in this zone. A strong breakout could open the door for further upside.
📈 Bullish Scenario:
If gold breaks above 3,878 with strong momentum, buyers may attempt to push the price toward the 3,892 area and potentially higher levels.
📉 Bearish Scenario:
If the price fails to hold support around 3,855–3,860, sellers could regain control and push gold toward lower levels.
📊 RSI Insight:
The RSI is around 63.5 on the chart, indicating positive short-term momentum. However, momentum can change quickly, especially on a 1-minute timeframe.
💡 My Trading Perspective
The key is to wait for confirmation instead of chasing every candle. Breakouts can fail, and support levels can break. Always manage risk, use appropriate stop-loss levels, and avoid entering a trade based on a single indicator.
⚠️ Risk Disclaimer: This analysis is for educational purposes only, not financial advice. Gold prices can move rapidly, and leveraged trading carries significant risk.
What do you think? Will gold break above resistance or pull back toward support? Share your analysis in the comments! 👇
#Binance #Gold #XAUUSD #GoldAnalysis #TechnicalAnalysis #TradingStrategy #CryptoCommunity