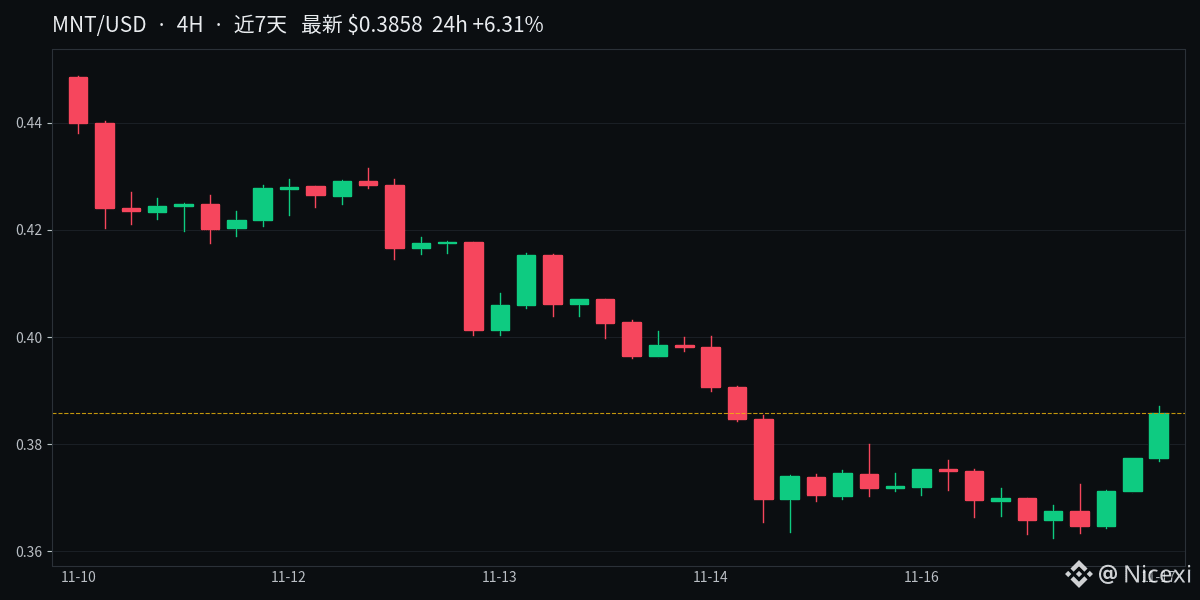
#Mantle Price action over the past two days has been interesting: $MNT fell nearly 20% from 0.4487, but tested the area around 0.363 twice without breaking below it. The lows have been rising steadily: 0.3634, 0.3644, 0.3712, 0.3769—a classic double-bottom pattern is taking shape.
The current price is 0.3915, up just over 6% in 24 hours. It has moved above the 4-hour MA25 (0.3822), and the MA7 has also turned upward. RSI at 62 isn't overheated, the MACD histogram has just turned positive, and a bullish crossover looks close. Trading volume is picking up too.
First, watch the upper Bollinger Band at 0.3959. If the price holds above it, the next levels to watch are 0.42 and the previous high area around 0.4487. If it falls back below 0.371, it will need to retest the 0.363 low.
The current price is 0.3915, up just over 6% in 24 hours. It has moved above the 4-hour MA25 (0.3822), and the MA7 has also turned upward. RSI at 62 isn't overheated, the MACD histogram has just turned positive, and a bullish crossover looks close. Trading volume is picking up too.
First, watch the upper Bollinger Band at 0.3959. If the price holds above it, the next levels to watch are 0.42 and the previous high area around 0.4487. If it falls back below 0.371, it will need to retest the 0.363 low.