$ZEC Is Green Today. But the Market Story Is Not That Simple.
There is something interesting about watching Zcash right now.
One day, the market looks weak. Then suddenly, a strong recovery appears, and everyone starts paying attention again.
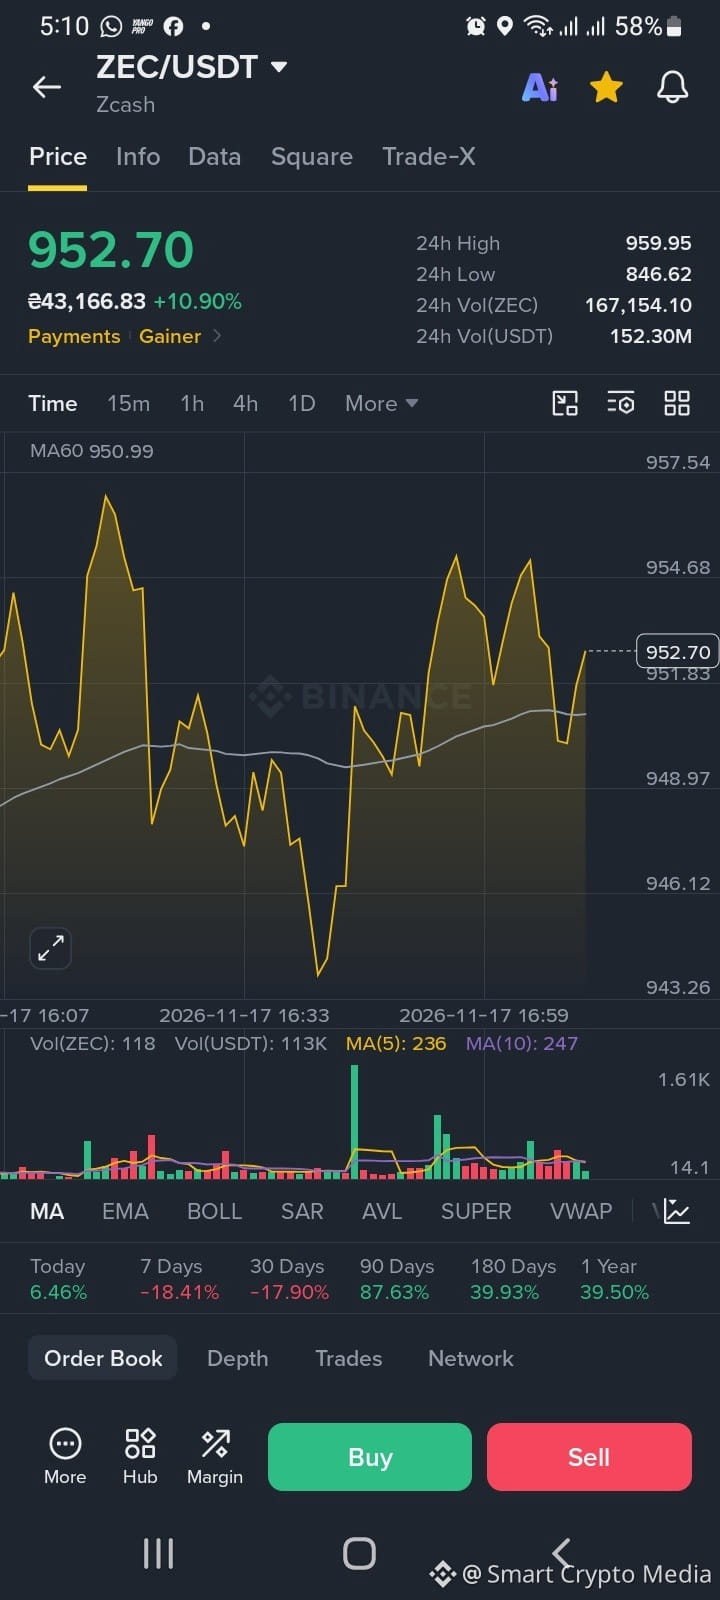
ZEC is currently around $952.70, showing a 10.90% daily increase.
That is a significant move.
But when I look beyond today's chart, the picture becomes less straightforward.
Seven-day performance: -18.41%.
Thirty-day performance: -17.90%.
Ninety-day performance: +87.63%.
Three different timeframes. Three different stories.
And that is probably what makes this market interesting.
Short-term price movements can completely change how people feel about an asset. A green chart creates excitement. A red chart creates doubt. Sometimes both reactions happen within the same week.
The current price is also slightly above the displayed MA60, which adds another interesting detail to the short-term picture.
Still, I wouldn't rush to label this a confirmed trend reversal.
Markets need more than one strong session to establish a sustainable direction.
For now, ZEC is worth watching from a market-structure perspective.
I am curious about how other people interpret this move.
Are you focusing on today's recovery, or are the negative weekly and monthly numbers more important to your analysis?
#ZEC #SmartCryptoMedia
Not financial advice.
There is something interesting about watching Zcash right now.
One day, the market looks weak. Then suddenly, a strong recovery appears, and everyone starts paying attention again.
ZEC is currently around $952.70, showing a 10.90% daily increase.
That is a significant move.
But when I look beyond today's chart, the picture becomes less straightforward.
Seven-day performance: -18.41%.
Thirty-day performance: -17.90%.
Ninety-day performance: +87.63%.
Three different timeframes. Three different stories.
And that is probably what makes this market interesting.
Short-term price movements can completely change how people feel about an asset. A green chart creates excitement. A red chart creates doubt. Sometimes both reactions happen within the same week.
The current price is also slightly above the displayed MA60, which adds another interesting detail to the short-term picture.
Still, I wouldn't rush to label this a confirmed trend reversal.
Markets need more than one strong session to establish a sustainable direction.
For now, ZEC is worth watching from a market-structure perspective.
I am curious about how other people interpret this move.
Are you focusing on today's recovery, or are the negative weekly and monthly numbers more important to your analysis?
#ZEC #SmartCryptoMedia
Not financial advice.