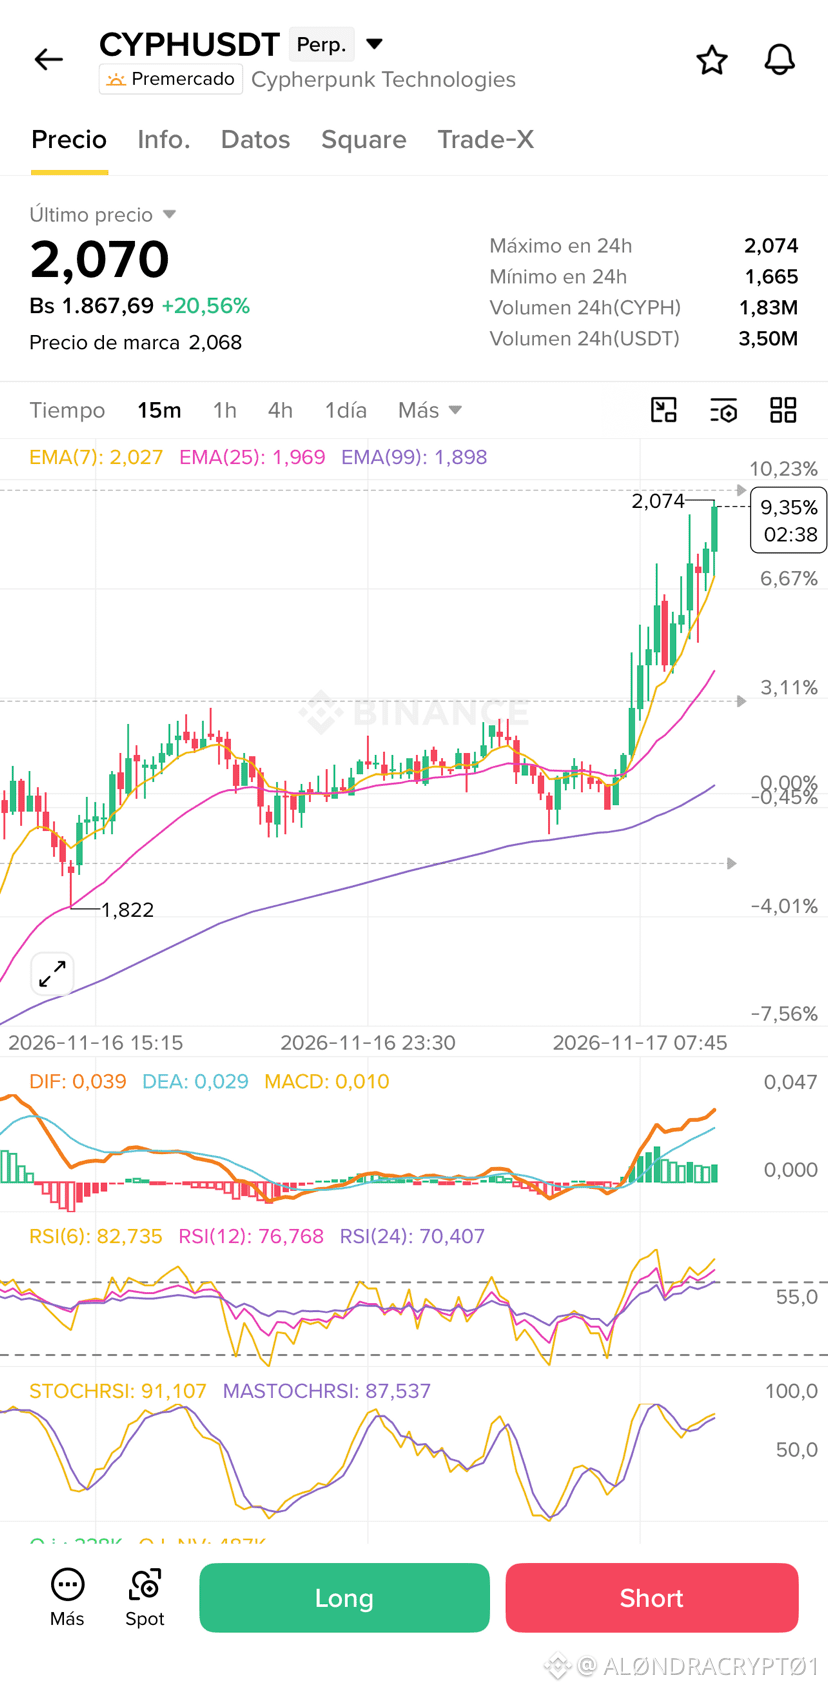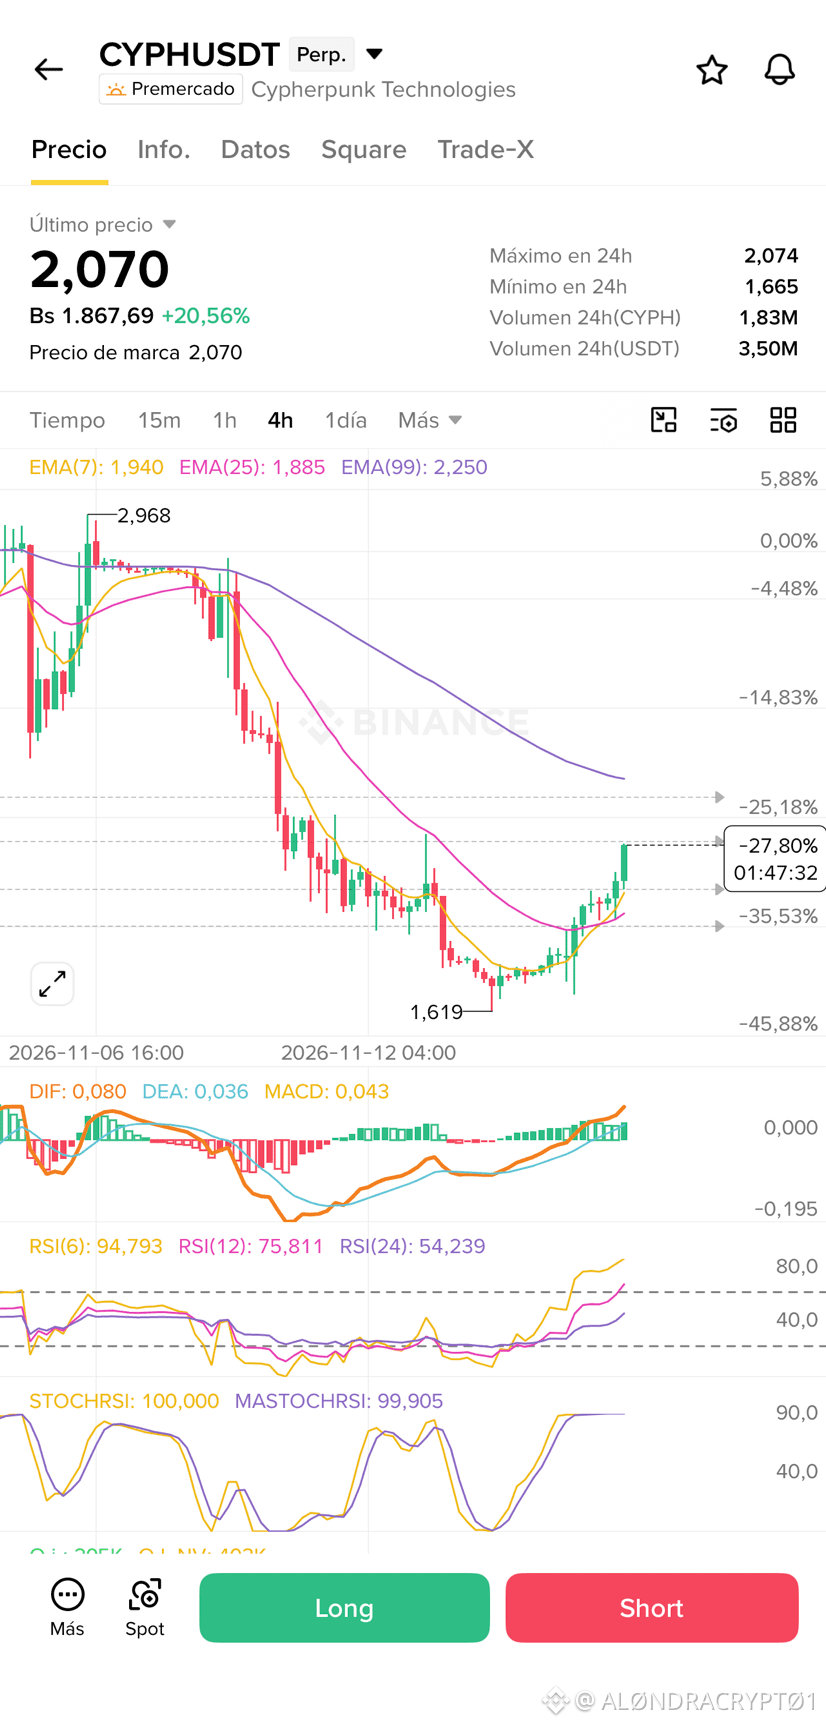

There are days when the market shows us its strength, and that is exactly what we’re seeing with $CYPH , which is currently trading at $2.070 after rising 20.56% for the day, reaching a new high of $2.074 and a low of $1.665. From a technical perspective on the 15-minute timeframe, the RSI indicator is in a high overbought zone, hovering around 82 points, and the StochRSI is up near 91, reflecting solid bullish momentum but making it necessary to watch closely for possible short-term exhaustion.
📌 Possible long entry: Wait for a controlled pullback toward the key support zone between $1.85 and $1.95.
Take Profit 1: $2.10
Take Profit 2: $2.25
Stop Loss: $1.75
📌 Possible short entry: Watch for a possible rejection or loss of momentum if the price attempts to test the upper resistance between $2.08 and $2.20.
Take Profit 1: $1.95
Take Profit 2: $1.80
Stop Loss: $2.26
When the price reaches an important support level, it’s essential not to jump the gun and to patiently observe the retest process. What we should watch for in that zone is the price dropping, touching support, leaving a quick rejection wick, and, above all, the 15-minute candle closing to show that buyers defended the level. If selling volume dries up and a candle with a solid body appears, closing above support, that confirms the retest was successful and the price is ready to rebound strongly, helping us avoid falling into the trap of panicking when the initial wick occurs.
If the price breaks strongly above $2.074, forget about short positions because the market will move upward due to FOMO. In that case, the patient and safer approach will be to wait for a pullback that tests that same zone as new support, then look for a long position with targets at $2.20 and $2.40, always protecting yourself with a stop loss below the broken level.
DYOR..
#AnalisisTecnico
📌 Possible long entry: Wait for a controlled pullback toward the key support zone between $1.85 and $1.95.
Take Profit 1: $2.10
Take Profit 2: $2.25
Stop Loss: $1.75
📌 Possible short entry: Watch for a possible rejection or loss of momentum if the price attempts to test the upper resistance between $2.08 and $2.20.
Take Profit 1: $1.95
Take Profit 2: $1.80
Stop Loss: $2.26
When the price reaches an important support level, it’s essential not to jump the gun and to patiently observe the retest process. What we should watch for in that zone is the price dropping, touching support, leaving a quick rejection wick, and, above all, the 15-minute candle closing to show that buyers defended the level. If selling volume dries up and a candle with a solid body appears, closing above support, that confirms the retest was successful and the price is ready to rebound strongly, helping us avoid falling into the trap of panicking when the initial wick occurs.
If the price breaks strongly above $2.074, forget about short positions because the market will move upward due to FOMO. In that case, the patient and safer approach will be to wait for a pullback that tests that same zone as new support, then look for a long position with targets at $2.20 and $2.40, always protecting yourself with a stop loss below the broken level.
DYOR..
#AnalisisTecnico