$HBAR: Teaching the ‘Why’ Behind Every Chart View
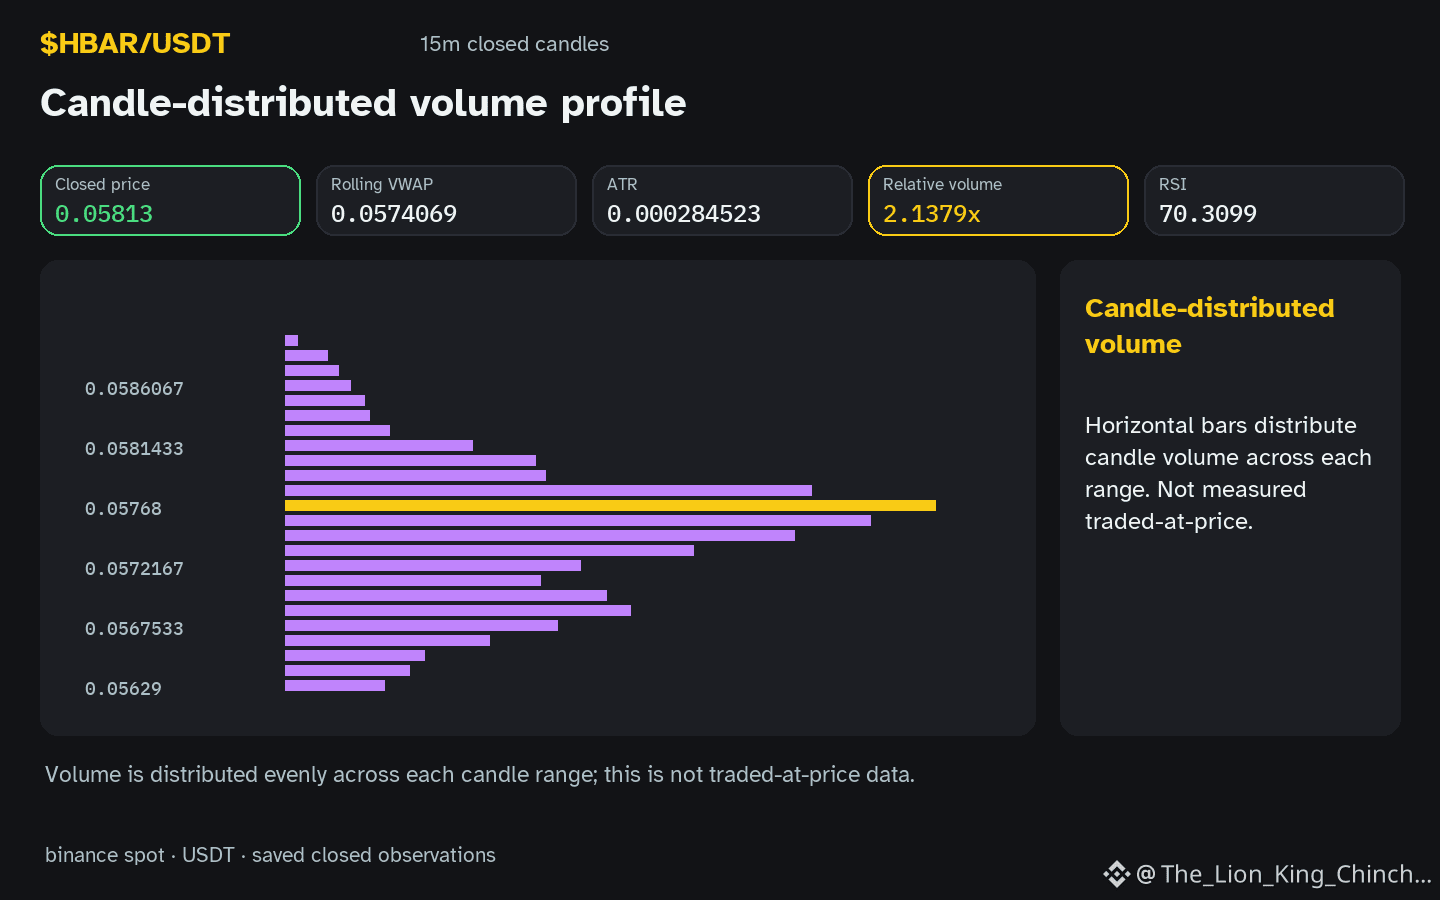
$HBAR: HBAR’s hourly chart shows an up move while volume is above baseline, suggesting that price action and activity may not align automatically. The question is: can a single observation be taken as a strong claim, or does it merely hint at a possible pattern?
A tempting shortcut is to see rising price and higher volume as confirmation of bullish momentum. However, this ignores the fact that a single candle can be influenced by many factors, and the data do not prove causation. For example, a price rise could simply be a continuation of a recent trend, or it might be driven by a large order that has no long‑term impact.
A more careful interpretation would pair the price movement with additional evidence. In this case, the relative volume is 2.14x baseline, and the RSI reading is 70.3. These metrics do not, by themselves, confirm a trend reversal or a breakout; they merely provide context. A counterexample occurs when a price increase is coupled with a low RSI, which might signal an overbought condition rather than a sustainable move.
A useful next observation is to compare the current hourly change of 0.536147% against the daily change of 0.745234%. If the hourly move is smaller than the daily trend, it could indicate that the up move is not a new trend but a retracement.
In reassessing the evidence, look for a closing candle that confirms the RSI and volume direction. If the next candle closes below the previous low, the initial bullish claim weakens. This method teaches readers to separate surface signals from deeper confirmation.
Probabilistic market research, not a recommendation or guaranteed return.
#HBAR #CryptoCommunity #CryptoLearning
$HBAR: HBAR’s hourly chart shows an up move while volume is above baseline, suggesting that price action and activity may not align automatically. The question is: can a single observation be taken as a strong claim, or does it merely hint at a possible pattern?
A tempting shortcut is to see rising price and higher volume as confirmation of bullish momentum. However, this ignores the fact that a single candle can be influenced by many factors, and the data do not prove causation. For example, a price rise could simply be a continuation of a recent trend, or it might be driven by a large order that has no long‑term impact.
A more careful interpretation would pair the price movement with additional evidence. In this case, the relative volume is 2.14x baseline, and the RSI reading is 70.3. These metrics do not, by themselves, confirm a trend reversal or a breakout; they merely provide context. A counterexample occurs when a price increase is coupled with a low RSI, which might signal an overbought condition rather than a sustainable move.
A useful next observation is to compare the current hourly change of 0.536147% against the daily change of 0.745234%. If the hourly move is smaller than the daily trend, it could indicate that the up move is not a new trend but a retracement.
In reassessing the evidence, look for a closing candle that confirms the RSI and volume direction. If the next candle closes below the previous low, the initial bullish claim weakens. This method teaches readers to separate surface signals from deeper confirmation.
Probabilistic market research, not a recommendation or guaranteed return.
#HBAR #CryptoCommunity #CryptoLearning