
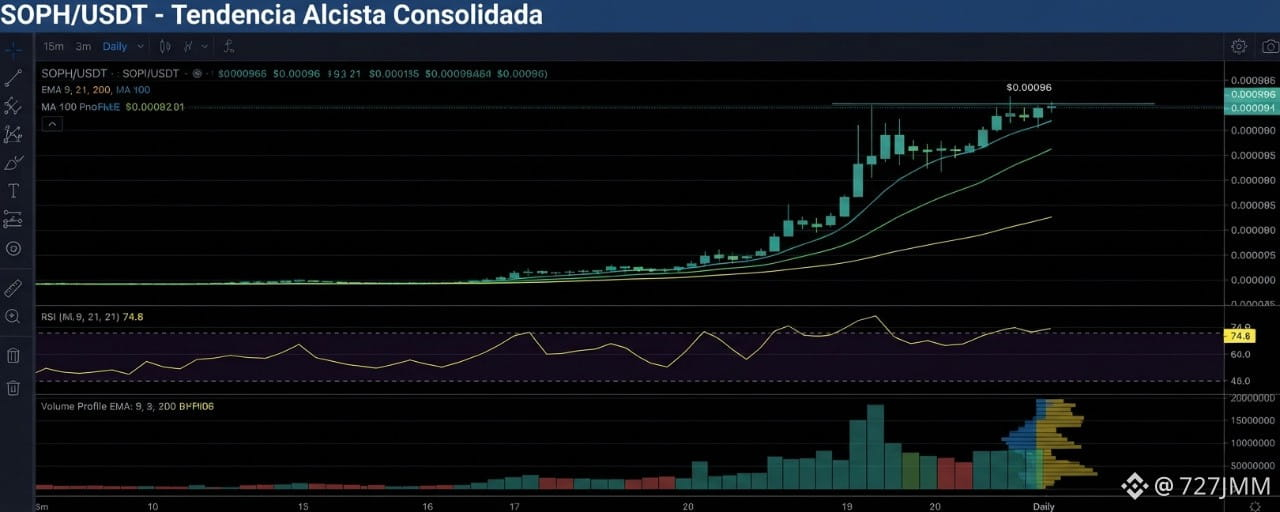


On the daily timeframe, SOPH/USDT maintains a solid accumulation structure after holding above macro support levels. On the 15m and 3m timeframes, the EMA 9 and EMA 21 have crossed above the MA 50 and 100, confirming a favorable short-term technical crossover, while the EMA 200 acts as the main dynamic floor.
The RSI (14) on the 15m chart is rebounding from the mid-range (around 48–52), clearing the previous oversold condition and preparing for a new push, supported by increasing buying volume. On the 3m chart, price compression suggests an imminent directional move toward the immediate resistance.
Trade Setup
Ideal Entry Zone: $0.00093 - $0.00096
TP1 (Conservative): $0.00102 (Secure partial profits and manage risk at breakeven)
TP2 (Intermediate): $0.00110 (Target based on 15m volume resistance)
TP3 (Moonshot): $0.00125 (Extended projection based on bullish range expansion)
Stop Loss (SL): $0.00088 (Strict technical invalidation level below structural support and the 15m EMA 200)
Trade Range and Confluence
The entry is based on a technically validated bounce at the confluence of the 200 EMA on the 15-minute timeframe, accompanied by the RSI moving out of oversold territory and a gradual increase in trading volume. The 3m structure shows the formation of higher lows, supporting a projected bullish continuation toward the stated targets with strict risk management.