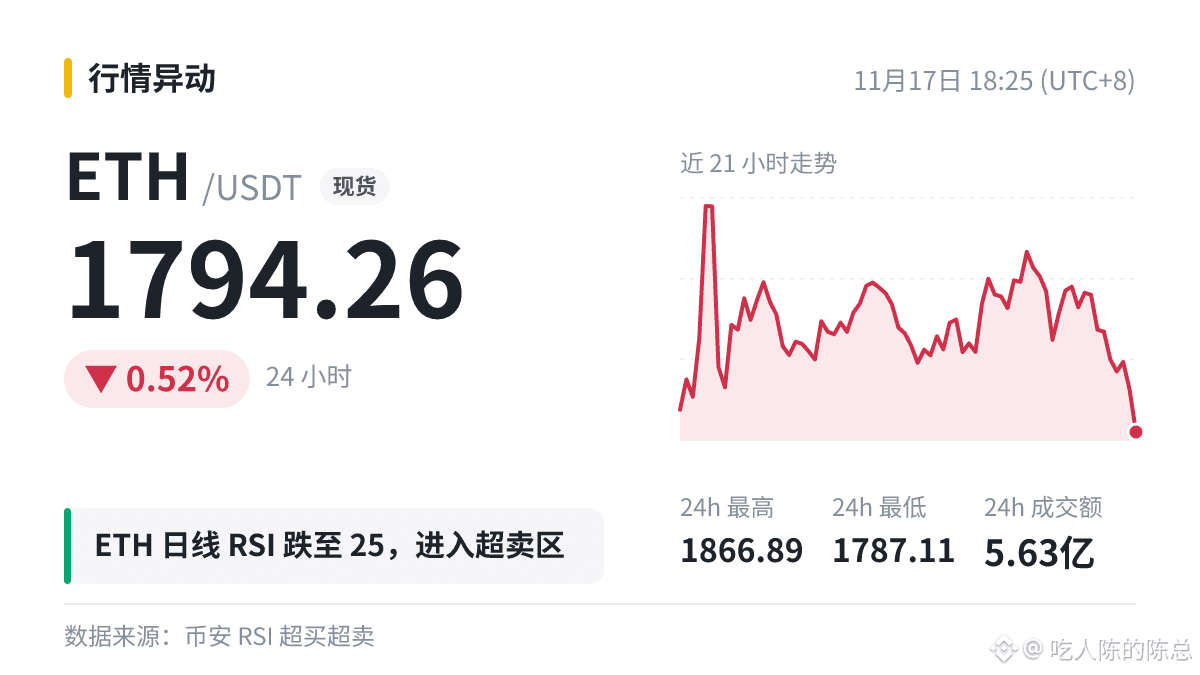
$ETH Daily RSI is 24.7, entering oversold territory, with the current price at 1794.26.
Let's use this figure to break down RSI.
In the classic interpretation, an RSI above 70 is considered overbought, while a reading below 30 is considered oversold; some traders use 80 / 20 as stricter thresholds.
Overbought and oversold readings on higher timeframes generally carry more weight than those on lower timeframes. Readings on the 4-hour chart occur more frequently and also involve more noise.
With leveraged trading, first work out whether you can withstand the worst-case scenario, then consider what the indicator is telling you.
#ETH
Ideas can be wrong at any time. Manage your own risk and returns.
Let's use this figure to break down RSI.
In the classic interpretation, an RSI above 70 is considered overbought, while a reading below 30 is considered oversold; some traders use 80 / 20 as stricter thresholds.
Overbought and oversold readings on higher timeframes generally carry more weight than those on lower timeframes. Readings on the 4-hour chart occur more frequently and also involve more noise.
With leveraged trading, first work out whether you can withstand the worst-case scenario, then consider what the indicator is telling you.
#ETH
Ideas can be wrong at any time. Manage your own risk and returns.