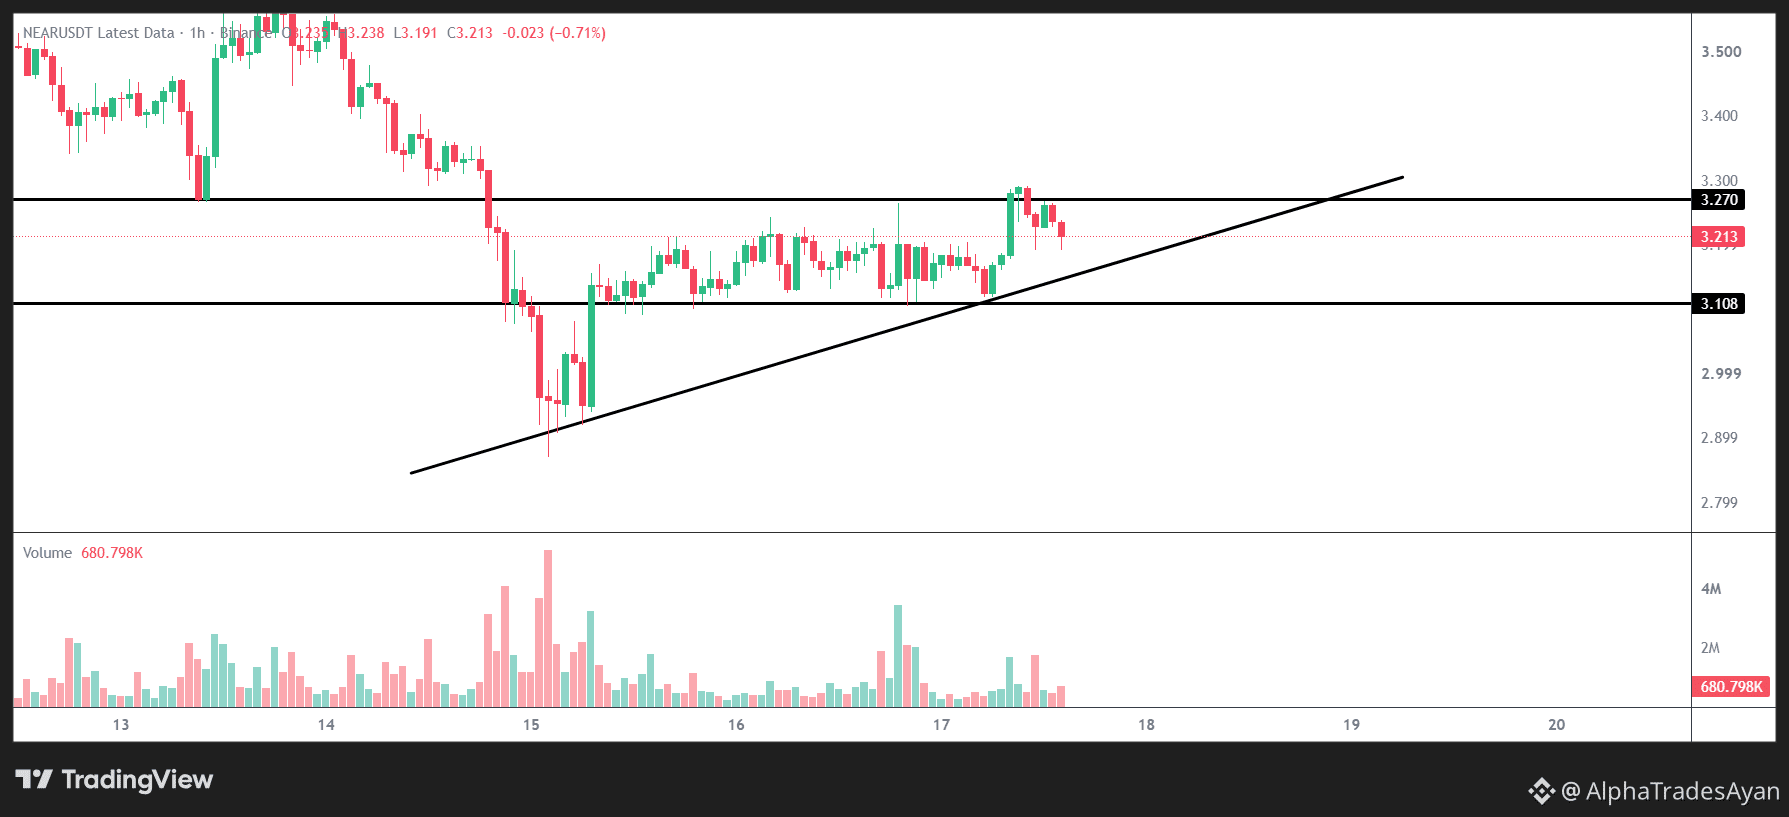
⚡ $NEAR /USDT 1H – Price Action Squeezed Between Ascending Trendline & Resistance! 🚨
The 1-hour chart on NEAR is presenting a classic technical ascending triangle structure right now. After establishing a solid recovery from the recent lows, buyers have consistently defended the rising trendline support, pushing the price action straight up to test the overhead horizontal barrier.
Currently, candles are consolidating just beneath the ceiling, narrowing the trading range as the market approaches a clear inflection point.
📊 Key Price Action Levels:
Overhead Resistance Ceiling: 3.270
Current Market Price: 3.213
Immediate Horizontal & Trendline Support: 3.108
$NEAR
A decisive 1H candle close above the 3.270 resistance zone—accompanied by expanding volume—could clear the path for a fresh structural leg upward. On the flip side, if this horizontal ceiling holds as heavy supply, expect a rotation back down to retest the rising trendline and the 3.108 support floor.
💬 How are you scanning this ascending structure?
👇 Drop a 🟢 if you expect a clean breakout above 3.270!
👇 Drop a 🔴 if you expect a pullback toward the 3.108 support!
NFA | DYOR
The 1-hour chart on NEAR is presenting a classic technical ascending triangle structure right now. After establishing a solid recovery from the recent lows, buyers have consistently defended the rising trendline support, pushing the price action straight up to test the overhead horizontal barrier.
Currently, candles are consolidating just beneath the ceiling, narrowing the trading range as the market approaches a clear inflection point.
📊 Key Price Action Levels:
Overhead Resistance Ceiling: 3.270
Current Market Price: 3.213
Immediate Horizontal & Trendline Support: 3.108
$NEAR
A decisive 1H candle close above the 3.270 resistance zone—accompanied by expanding volume—could clear the path for a fresh structural leg upward. On the flip side, if this horizontal ceiling holds as heavy supply, expect a rotation back down to retest the rising trendline and the 3.108 support floor.
💬 How are you scanning this ascending structure?
👇 Drop a 🟢 if you expect a clean breakout above 3.270!
👇 Drop a 🔴 if you expect a pullback toward the 3.108 support!
NFA | DYOR