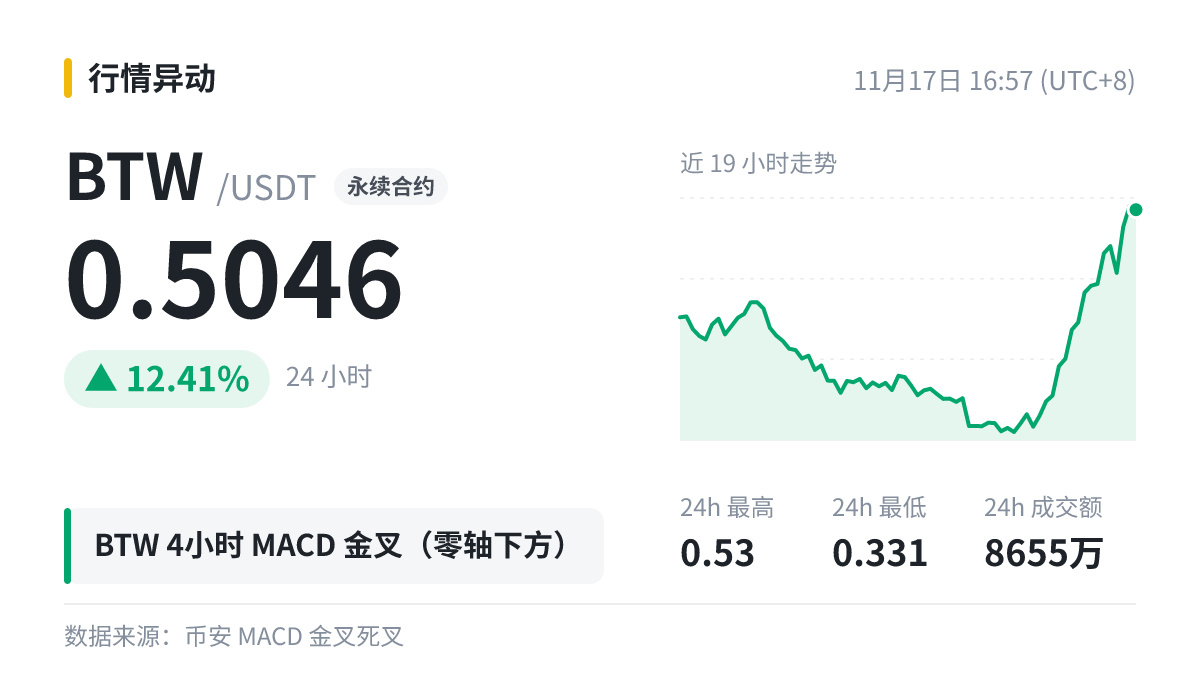
$BTW 4The hourly chart has just produced a MACD golden cross (below the zero line). Before the crossover, bearish momentum bars persisted for 34 four-hour candles.
It’s easy to misread the signal if you look only at the crossover, so I’ll check these three things in order:
① After the bars turn positive, do they keep getting longer?
② Is trading volume confirming the move?
③ Can the price break above the nearest resistance level?
The four-hour chart is more suited to short-term trading, so it should be viewed alongside the daily trend. What reasons do you have for being bullish or bearish?
It’s easy to misread the signal if you look only at the crossover, so I’ll check these three things in order:
① After the bars turn positive, do they keep getting longer?
② Is trading volume confirming the move?
③ Can the price break above the nearest resistance level?
The four-hour chart is more suited to short-term trading, so it should be viewed alongside the daily trend. What reasons do you have for being bullish or bearish?