
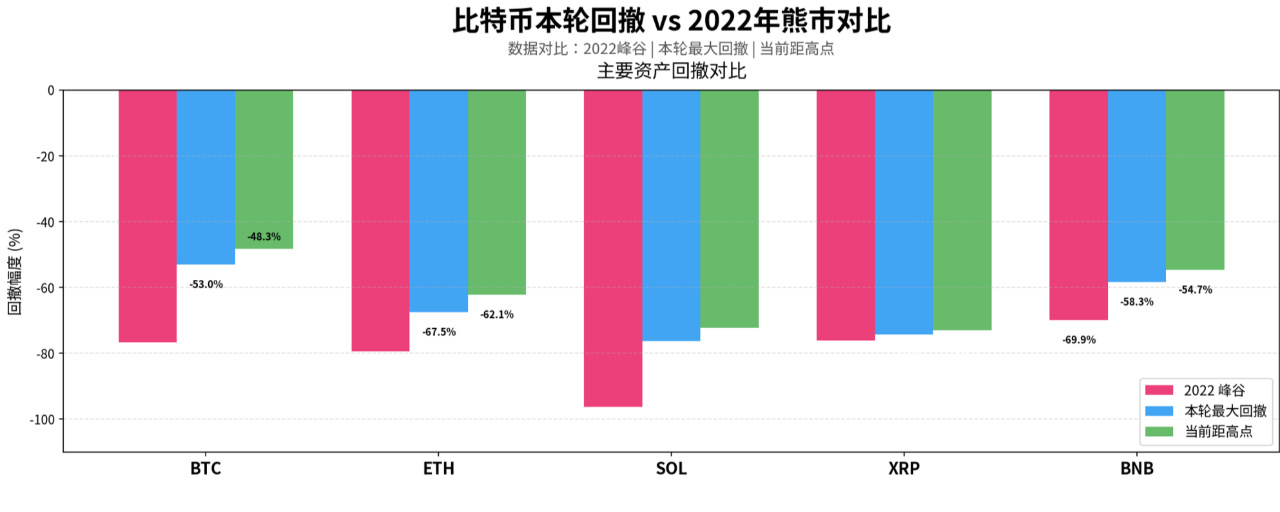


In terms of magnitude, this downturn has been shallower than in 2022: Bitcoin fell from its all-time high of 124,740 on October 7, 2025, to 64,545, a maximum drawdown of -53.0%; the 2021–2022 downturn was -76.6%, a difference of 23 percentage points. Ethereum shows a similar pattern: -67.5% in this downturn, versus -79.3% in 2022.
But in terms of duration, this downturn has already lasted longer than the previous one: 406 days since the peak, compared with 378 days to bottom in 2022. And this so-called “shallower” decline applies only to large-cap assets such as Bitcoin and BNB; most altcoins have already come close to, or even matched, their 2022 losses. SOL’s maximum drawdown in this downturn is -76.3%, and XRP’s is -74.3%—the latter almost exactly replicating its -76% decline in 2022. So a more accurate way to put it is not “this time the decline is smaller than in 2022,” but “Bitcoin has been supported by ETF and institutional buying, while other assets are still falling according to the usual bear-market script.”
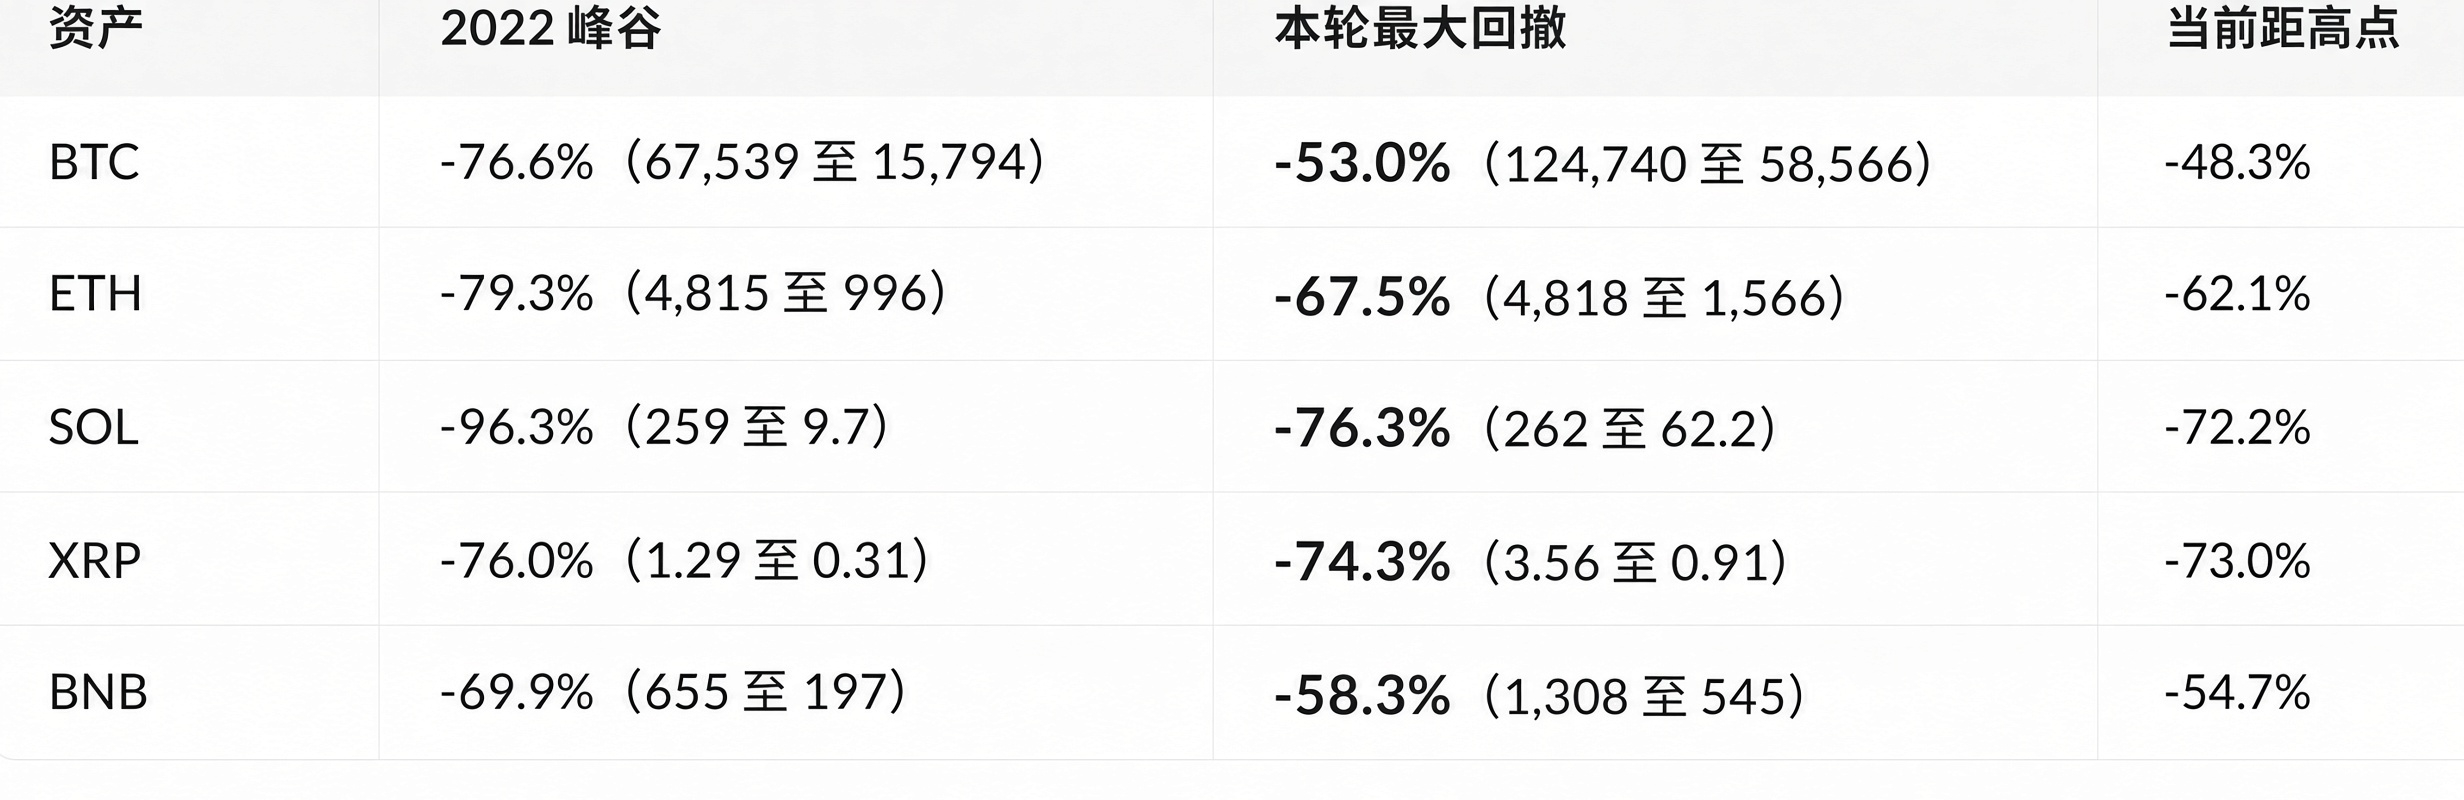
The divergence between the two cycles is clear. Bitcoin and BNB have seen notably smaller drawdowns, reflecting the cash flows of spot ETFs and exchange tokens, respectively; ETH is in the middle; and SOL and XRP are almost back to their 2022 levels. XRP’s year-to-date low came just two days ago (November 15), showing that liquidations are still underway, not over.
To match 2022, Bitcoin would need to fall to around 29,000—another 55% down from the current 64,545. That level would require a systemic event to materialize; it wouldn’t come about naturally through a continuation of the current trend.
Time: this cycle has lasted longer and its structure is more distorted
This cycle’s defining feature isn’t how sharply it has fallen, but how long it has dragged on and how distorted its structure has become.
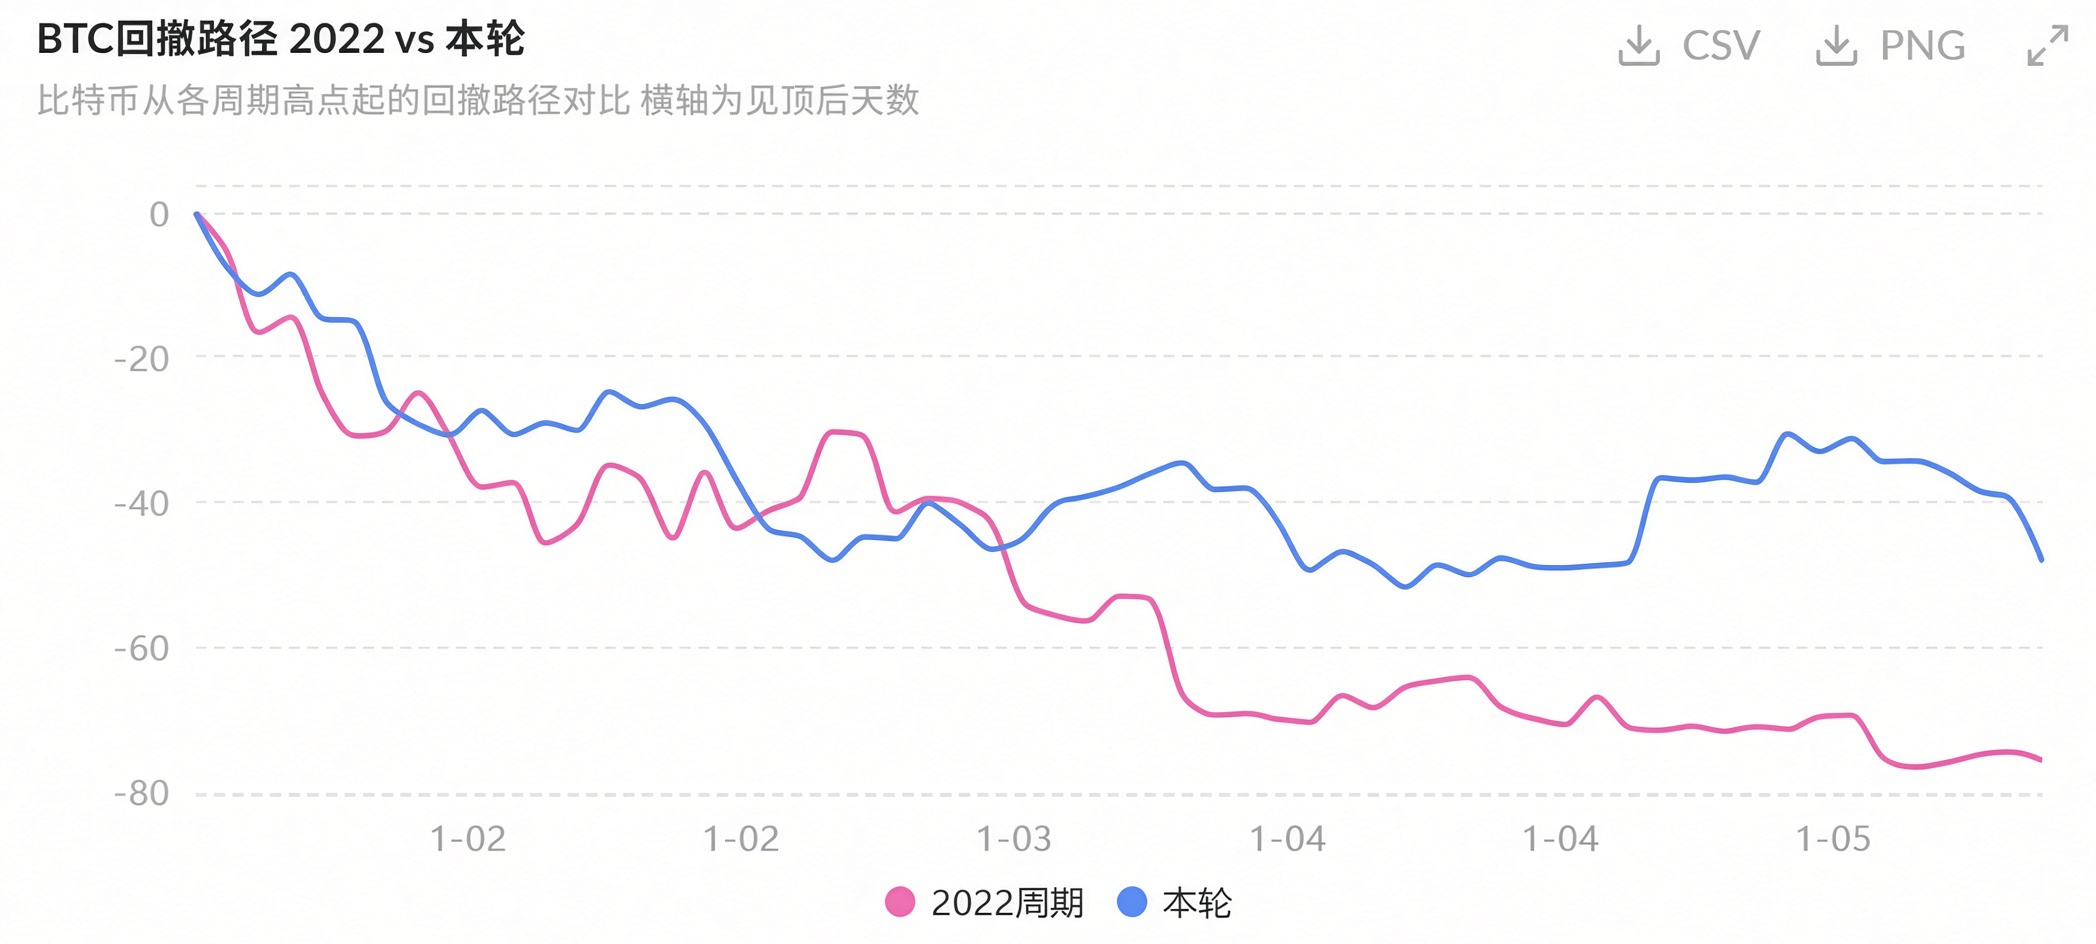
In 2022, it was a “straight-down” decline: Bitcoin fell about 45% in the first 100 days after peaking, then moved sideways until Luna, Three Arrows Capital, and FTX collapsed one after another, completing a 76.6% decline over 378 days. This cycle has been the opposite: on July 1, 2026, it first fell to 58,566, a 53% drop; on September 22, it rebounded to 86,597, a 48% gain; then it fell another 25.5%, bringing it to the current 64,545.
A lower high followed by another leg down makes this pattern look worse than in 2022. The 2022 sell-off was a one-way liquidation with a clear endpoint; this cycle is “a fake rebound, then another round of selling,” repeatedly draining bullish confidence. The fear index staying between 11 and 13 for three consecutive days is a result of this pattern.
Why the decline hasn’t gone deeper this time
The main reason the 2022 decline reached 77% was a collapse in credit. An algorithmic stablecoin went to zero, lending platforms became insolvent, and an exchange misappropriated customer assets. Each time, it was the same negative feedback loop: “asset prices fall, institutions go bankrupt, triggering more selling.” Price was only the outcome; the leverage structure was the underlying cause.
So far, this cycle hasn’t seen a credit event on the same scale. Redemptions have been mechanical, with no panic-driven run; $90.87 million in liquidations across the market over 24 hours would have been an ordinary day in 2022; and Bitcoin’s funding rate is still +0.0042%, or 4.6% annualized. Bulls haven’t given up completely, but neither has enthusiasm reached the point where all leverage needs to be flushed out at once.
The presence of ETFs has changed the slope of the downturn. They create ongoing selling pressure through redemptions (Bitcoin spot ETFs saw about $600 million in net outflows over four days from November 11 onward), while also providing passive buying support at lower levels. That’s why Bitcoin’s decline stopped at 53%, while SOL fell to 76%: capital is protecting the index, not the narrative.
What would it take to match 2022?
For this cycle’s decline to rival 2022, we would need to see evidence that “falling prices have breached a particular asset-liability structure.” The closest thing to meeting this condition right now is Bitcoin treasury companies: their average cost bases are generally between $70,000 and $80,000, and at 64,545 they are all sitting on unrealized losses. If prices fall another leg, forcing them to cut holdings, face credit-rating downgrades, or lose access to financing, those paper losses could turn into real selling pressure. That is the only path this cycle has to a potential 70% decline.
Until then, 74,000 and 78,000 are levels that must hold: lose one, and the range shifts down a notch. Conversely, reclaiming 68,000 would only count as stabilization; getting above 86,600 (the September rebound high) would signal structural repair—not a return to a bull market just because Bitcoin breaks above 90,000.
Based on the facts so far, the 2022 cycle was a deeper bear market. This cycle hasn’t matched it in depth, but it has already lasted longer. The real difference isn’t the size of the decline, but which assets have borne the brunt: last cycle, everything went to zero together; this time, institutions are propping up Bitcoin while altcoins are being swallowed by liquidations. So the claim that “it hasn’t been as bad this time” only holds for large-cap assets. If you’re holding positions like SOL or XRP that are already down 70%, it feels like you’re fighting the 2022 battle all over again.
Treat 58,566—not 64,000—as the final benchmark for this bear market: only a break below it would make this cycle comparable to 2022 in depth; if it holds, this will be the shallowest Bitcoin bear market on record, while altcoin liquidations continue.