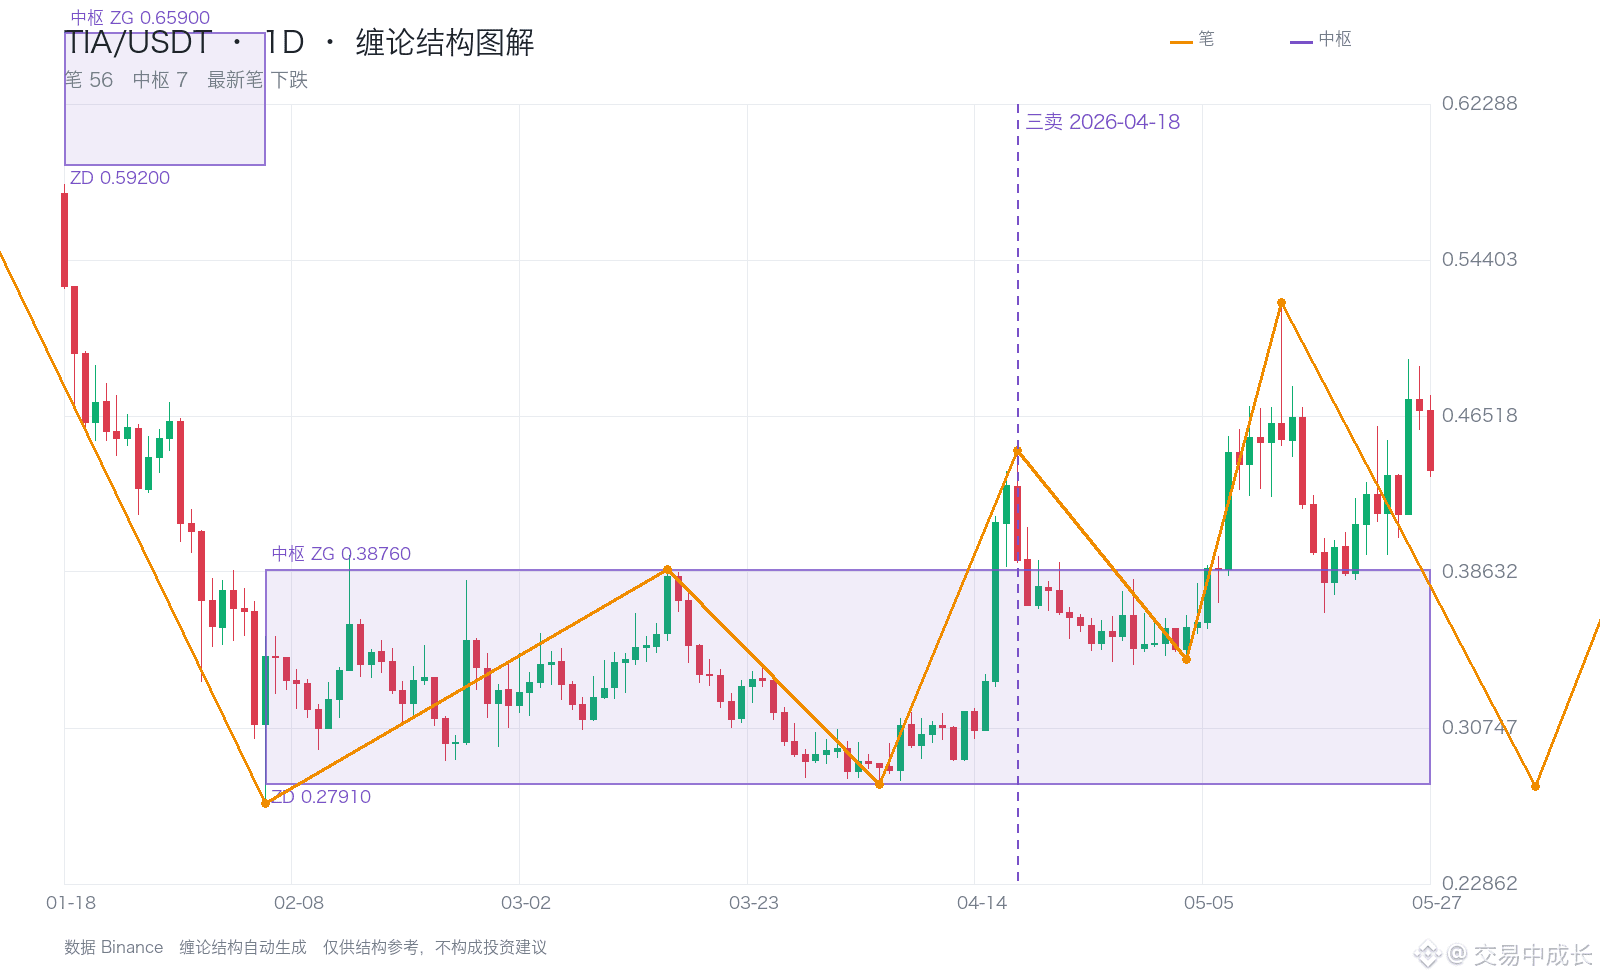
Review of a historical case: On April 18, 2026, the engine identified TIA’s 1d-level structure as a third sell.
The lower boundary of the original pivot for this signal was 0.59200, and the marked price of 0.44760 was below this reference price.
Over the following 20 candlesticks, the price reached a low of 0.33960, with a maximum favorable excursion of 24.1% relative to the marked price. The closing price at the end of the window was 0.44680.
A review should also consider adverse price movements along the way, rather than focusing only on how much ground was ultimately covered.
This is a retrospective structural review. The period’s high and low prices are not equivalent to actual trading returns, nor do they mean that the signal could have been confirmed at the time.
$TIA $BTC $ETH #缠论 #加密安全 #On-chain fund tracking
The lower boundary of the original pivot for this signal was 0.59200, and the marked price of 0.44760 was below this reference price.
Over the following 20 candlesticks, the price reached a low of 0.33960, with a maximum favorable excursion of 24.1% relative to the marked price. The closing price at the end of the window was 0.44680.
A review should also consider adverse price movements along the way, rather than focusing only on how much ground was ultimately covered.
This is a retrospective structural review. The period’s high and low prices are not equivalent to actual trading returns, nor do they mean that the signal could have been confirmed at the time.
$TIA $BTC $ETH #缠论 #加密安全 #On-chain fund tracking