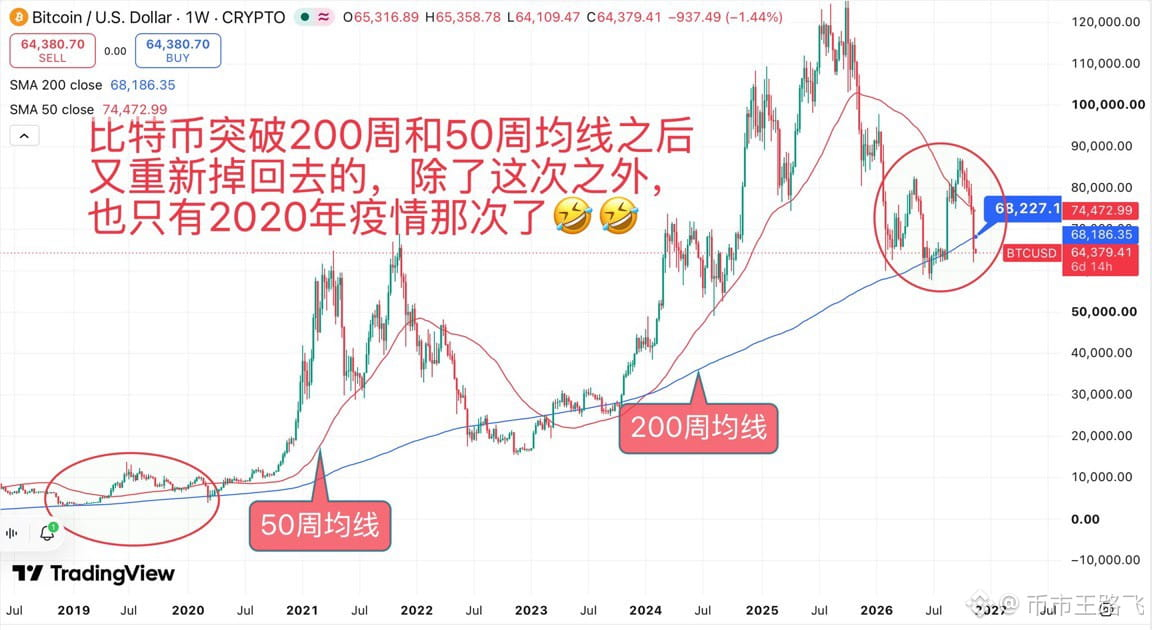
Today I took a look at Bitcoin’s weekly chart over the past few years and noticed that the current price action really does feel a bit like the COVID crash in 2020! 🤣
$BTC
In 2019, BTC climbed back above its 200-week and 50-week moving averages, only to be knocked back down by the COVID black swan in 2020. But after breaking below them, it quickly climbed back above, and we all know what happened next: a huge bull market.
#黄仁勋能否复任CEO?英伟达董事会:暂不考虑
Now BTC has fallen below both moving averages again, currently at just $64,300, while the 200-week moving average is still around $68,200. Honestly, this sell-off has been brutal! But I’m curious to see whether it can reclaim the 200-week moving average this time, just like it did in 2020.
Of course, the macro environments are completely different, so we can’t expect history to repeat itself exactly.
The question is, will this be another major opportunity, or does the market still need more time to bottom out?
$BTC
In 2019, BTC climbed back above its 200-week and 50-week moving averages, only to be knocked back down by the COVID black swan in 2020. But after breaking below them, it quickly climbed back above, and we all know what happened next: a huge bull market.
#黄仁勋能否复任CEO?英伟达董事会:暂不考虑
Now BTC has fallen below both moving averages again, currently at just $64,300, while the 200-week moving average is still around $68,200. Honestly, this sell-off has been brutal! But I’m curious to see whether it can reclaim the 200-week moving average this time, just like it did in 2020.
Of course, the macro environments are completely different, so we can’t expect history to repeat itself exactly.
The question is, will this be another major opportunity, or does the market still need more time to bottom out?